


The Price of Natural Gas Finds Support. But for How Long?
FXOpen

On 21 June, we wrote that the trend in the market was weakening, noting that:
→ Forecasts of a hotter summer, published during April-May, led to a sustained bullish trend in the natural gas market.
→ According to the technical analysis of the 4-hour XNG/USD chart and the signs of weakness that have formed on it, the level of 3.160 appears to sufficiently account for the risks of an extremely hot summer.
→ Bears might push the price to the lower boundary of the ascending trend channel.
Since then, the price of natural gas has:
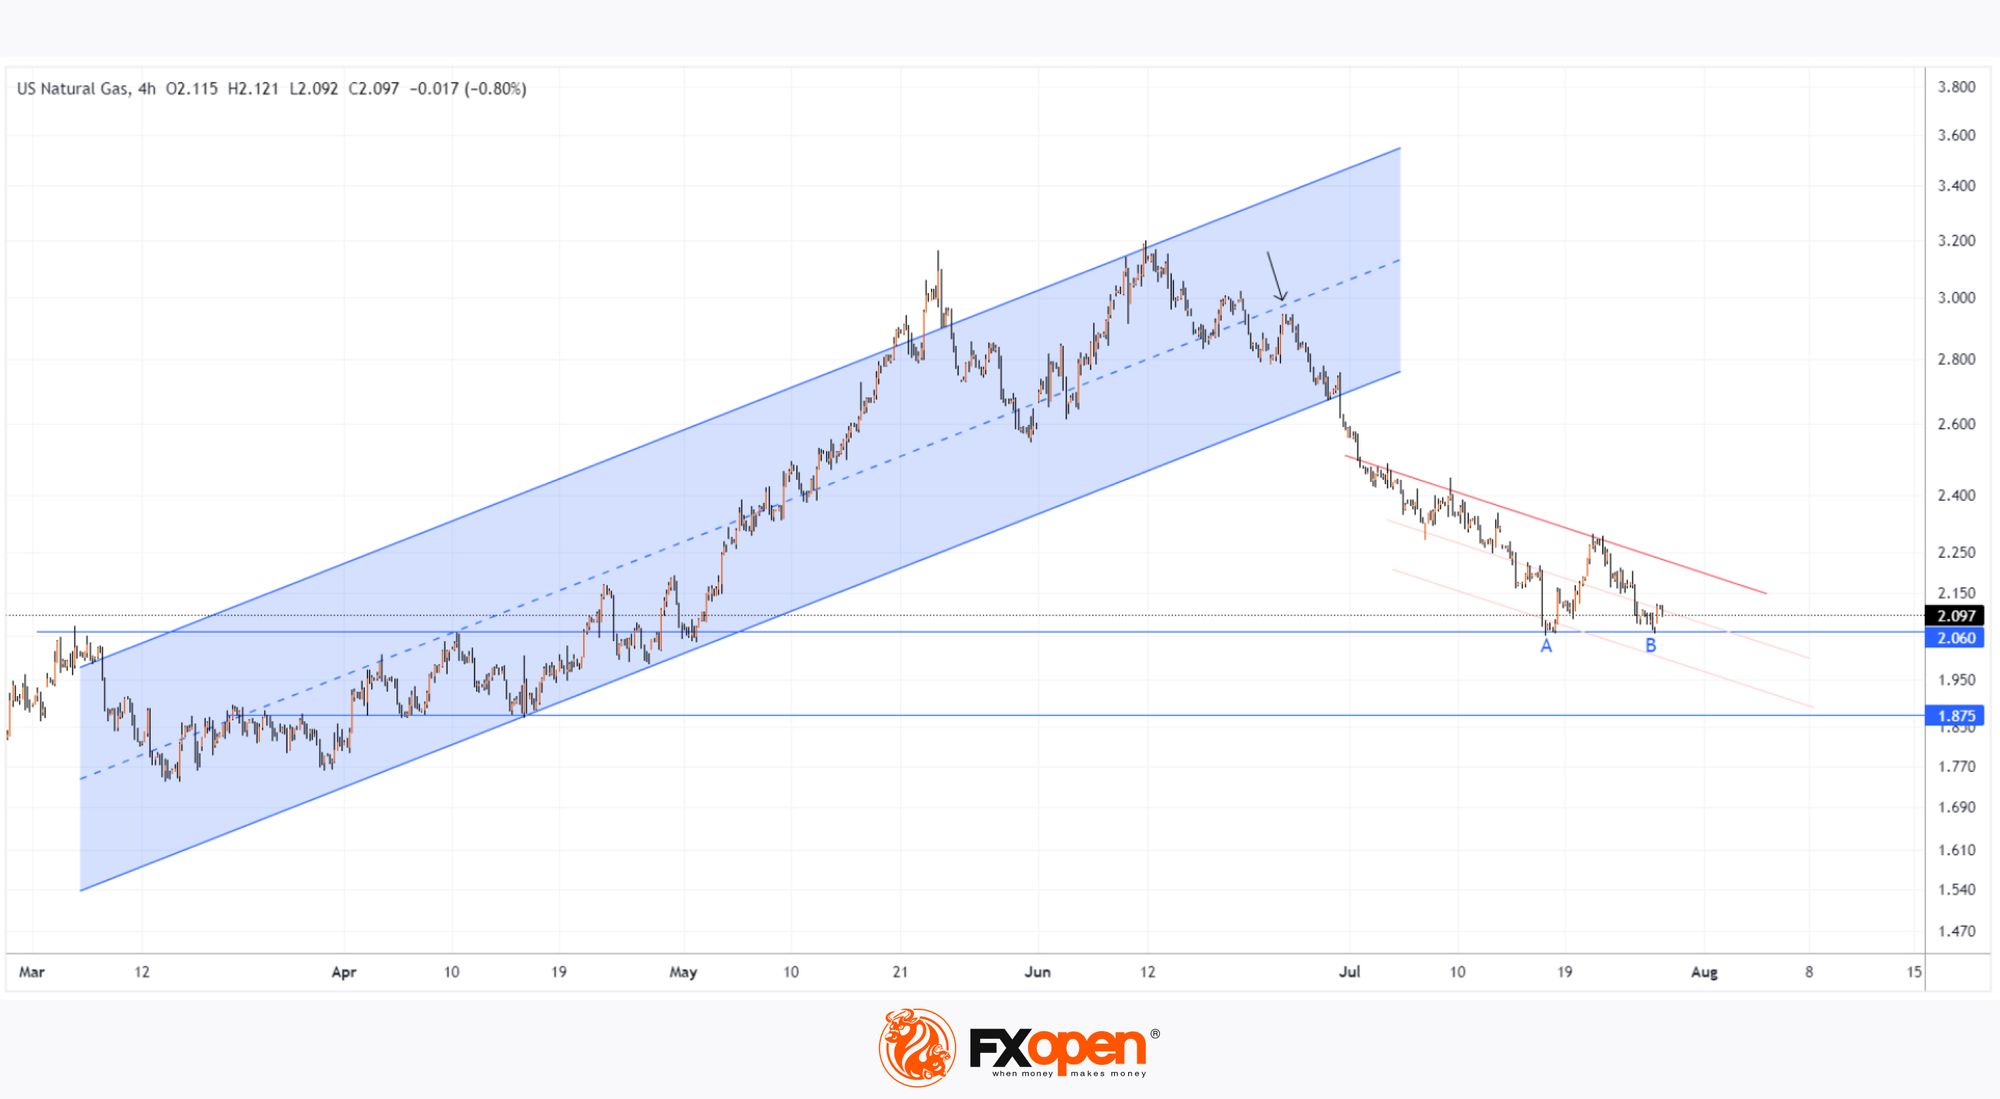
→ tested the median of the ascending channel (shown by an arrow), which acted as resistance;
→ broken the lower boundary of the channel;
→ dropped to the level of 2.06 amid news of sufficient natural gas reserves in storage.
And, as the XNG/USD chart shows today, it is this level that is now forming signs of support for the market:
→ the lows A-B appear to be elements of an incomplete double bottom pattern;
→ the level of 2.06 acted as resistance in March-April, so support here is anticipated by technical analysts.
But can the bulls reverse the trend?
In the near future, the price of natural gas may consolidate within a narrowing triangle, formed by the support at 2.06 and the descending trend line (shown in red). It is possible that failures in any attempts to break through the red line will lead to a resumption of the downward trend and a subsequent decline in price towards the support at 1.875.
Start trading commodity CFDs with tight spreads (additional fees may apply). Open your trading account now or learn more about trading commodity CFDs with FXOpen.
This article represents the opinion of the Companies operating under the FXOpen brand only. It is not to be construed as an offer, solicitation, or recommendation with respect to products and services provided by the Companies operating under the FXOpen brand, nor is it to be considered financial advice.
Stay ahead of the market!
Subscribe now to our mailing list and receive the latest market news and insights delivered directly to your inbox.


Latest articles

US Dollar Index: A Defining Week for the King of the Markets
The dollar heads into a pivotal week trading near 101.80, just off a 15-month high, with the Fed's July 29 meeting standing as the clear focal point. Markets currently price roughly a 65% chance of a hold, though renewed

NZD/USD: Inflation Surge Meets Strong US Dollar Pressure
On 21 July, Stats NZ reported an acceleration in inflation: the Consumer Price Index rose 1.5% in the second quarter, while the annual inflation rate climbed to 4.1%, its highest level in more than two years and slightly

Weekly Market Insights with Gary Thomson: The Week of Central Banks and Earnings
In this video, we’ll explore the key economic events and market trends, shaping the financial landscape. Get ready for insights into financial markets to help you navigate the week ahead. Let’s dive in!
In this episode of Market