


FXOpen
On March 14, we wrote: “The US500 stock index market is showing signs of positivity, indicating that an attempt to overcome the resistance of 5,200 points with a new record high may be made in the near future.” Yesterday's event created the momentum that allowed the bulls to do this.
On Wednesday evening it became known that it was decided to keep the interest rate at 5.5% in the US — this was expected. What market participants paid more attention to was the dovish tone of the Fed. Thus, it became known that by the end of 2024 there may be 3 consecutive rate cuts.
According to Jerome Powell:
→ recent inflation data turned out to be hotter than expected;
→ however, “in fact, the overall story has not changed, it is a gradual decline in inflation along a somewhat bumpy road.”
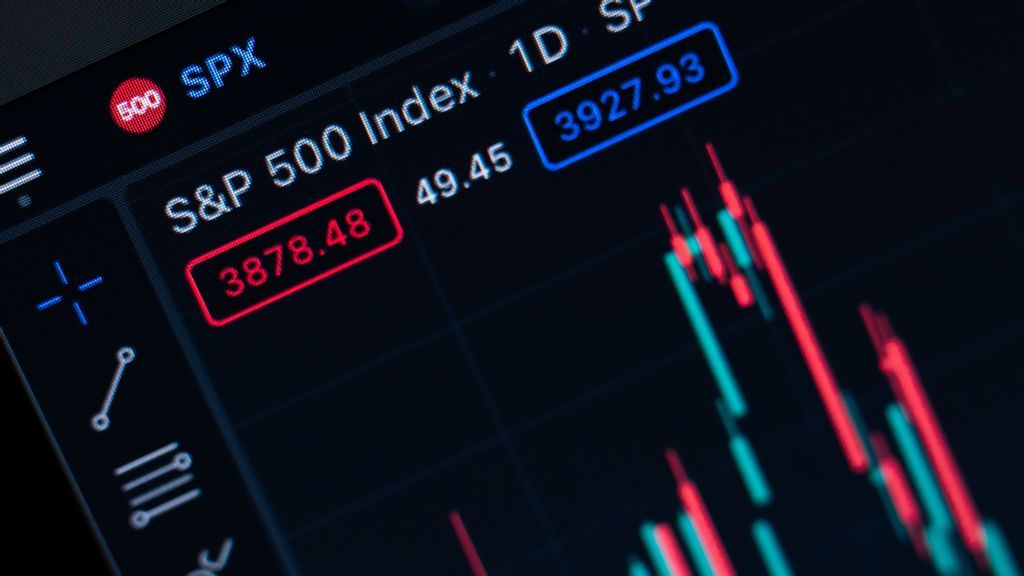
Thus, fears associated with a longer period of tight monetary policy have been dispelled. As a result, the US dollar fell in price against a number of currencies, and the US stock market index S&P 500 soared to a new historical high around the level of 5,250.
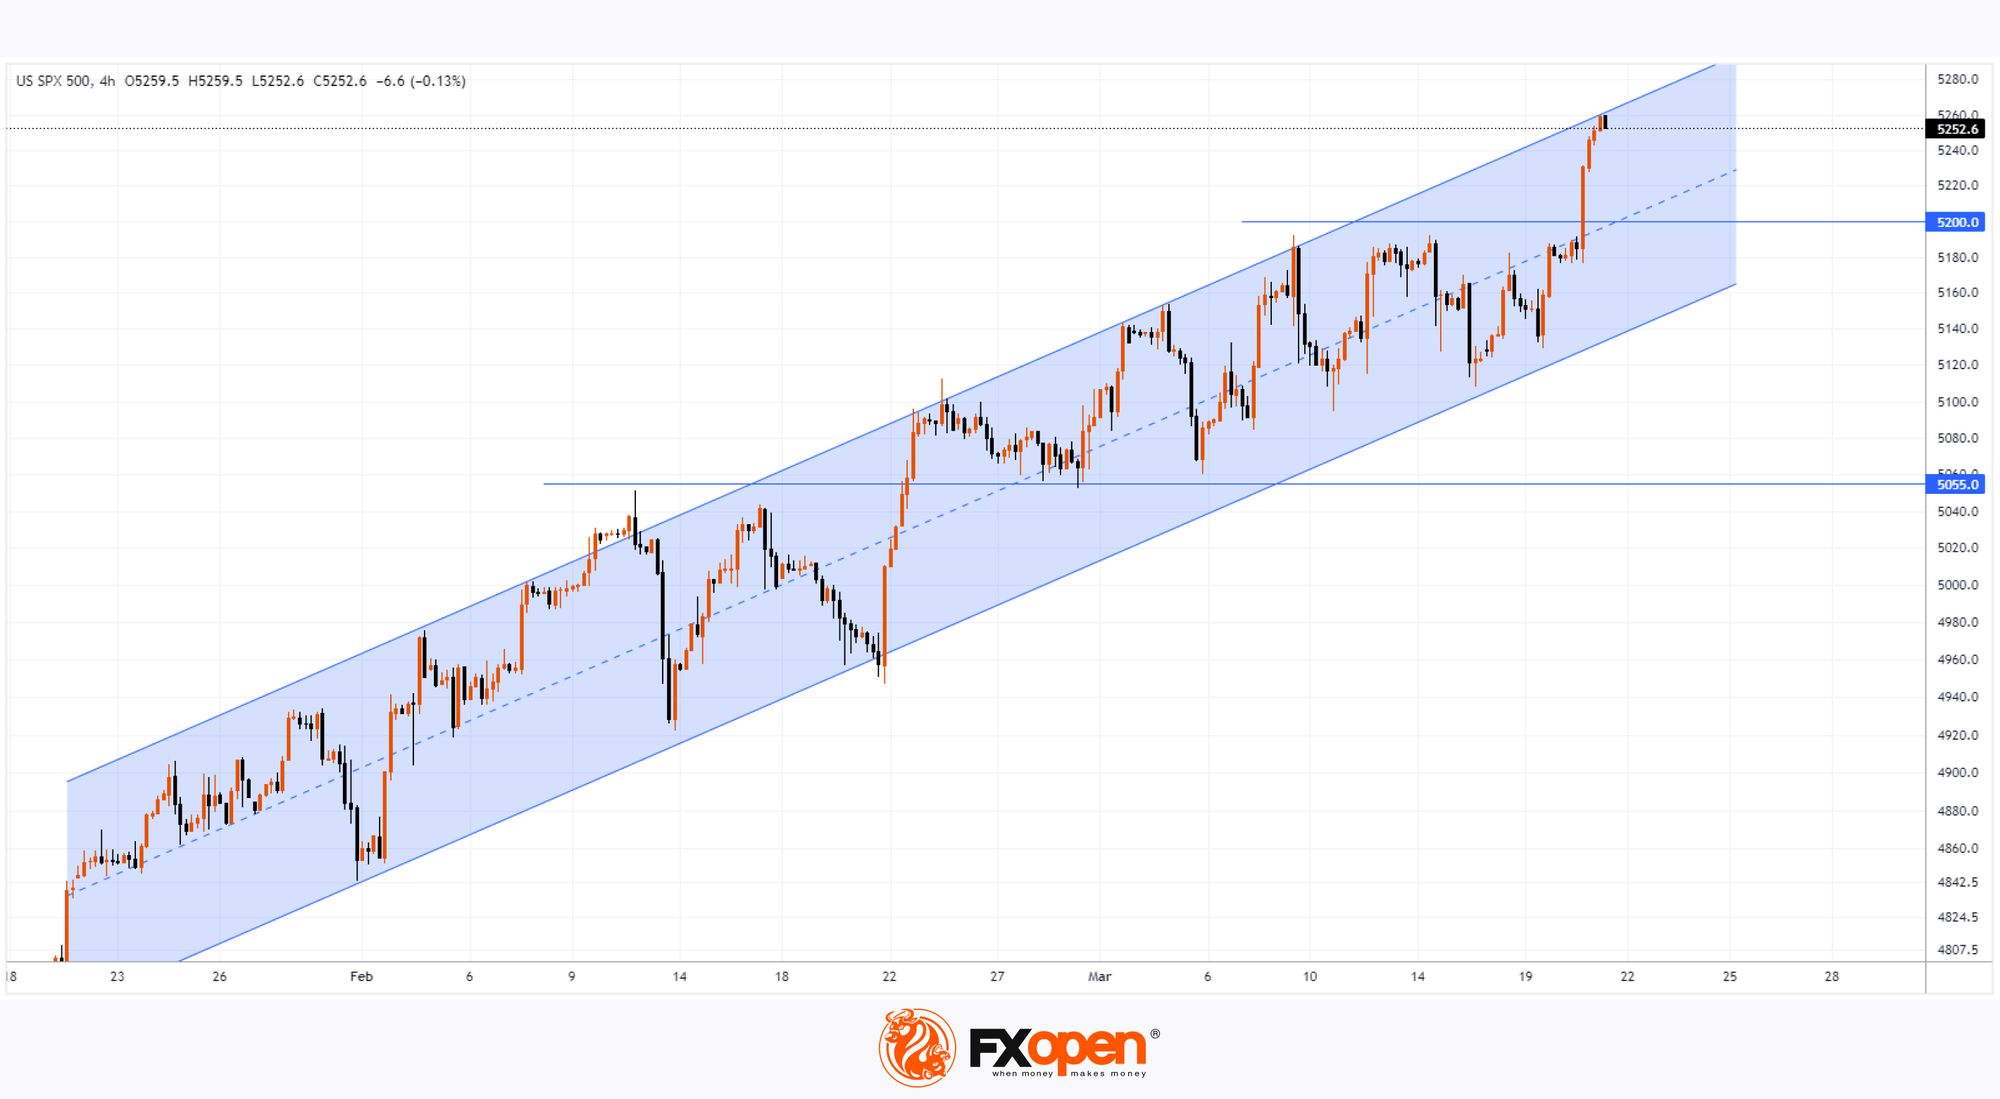
Technical analysis of the US500 chart today shows that:
→ the market continues its upward trend (shown by the blue channel);
→ the price is in the upper half of the channel – a sign of increased demand.
However, the price of US500 is near the upper border of the channel, which makes the market vulnerable to a correction to the support level from the historical top — a similar pattern has been formed more than once since the beginning of 2024.
Support can be provided by:
→ median line of the channel and its lower border;
→ level 5200, from which we can expect a change in role from resistance to support - as was the case with level 5055.
Trade global index CFDs with zero commission and tight spreads (additional fees may apply). Open your FXOpen account now or learn more about trading index CFDs with FXOpen.
This article represents the opinion of the Companies operating under the FXOpen brand only. It is not to be construed as an offer, solicitation, or recommendation with respect to products and services provided by the Companies operating under the FXOpen brand, nor is it to be considered financial advice.
Stay ahead of the market!
Subscribe now to our mailing list and receive the latest market news and insights delivered directly to your inbox.


Latest articles

Weak Data Weigh on the Dollar: Market Awaits Trend Confirmation
The US dollar is retreating from recent highs, moving into a moderate correction after a prolonged period of gains. Pressure on the currency is building amid weaker-than-expected macroeconomic data, while market participants adopt a wait-and-see approach ahead of key labour

Market Analysis: EUR/USD Aims Recovery While USD/JPY Gives Back Recent Gains
EUR/USD is recovering losses from 1.1450. USD/JPY is correcting gains from 160.50 and might decline further below 158.00.
Important Takeaways for EUR/USD and USD/JPY Analysis Today
· The Euro struggled to stay in a

European Currencies Decline: Pound Hits New Lows, Euro Under Pressure
European currencies continue to weaken against the US dollar amid rising geopolitical tensions and increased demand for safe-haven and liquid assets. Market participants are reducing exposure to riskier instruments, putting pressure on both the euro and the pound. Additional support