


FXOpen
Analysing the XAU/USD chart on October 18, we:
→ Established a long-term upward channel (indicated in blue);
→ Suggested that the target for bulls might be the upper red line, drawn parallel to the red corrective channel.
Since then:
→ The gold price rose to the upper red line and the top of the blue channel,
→ But then experienced a bearish reversal, dropping sharply on October 31 amid economic news.
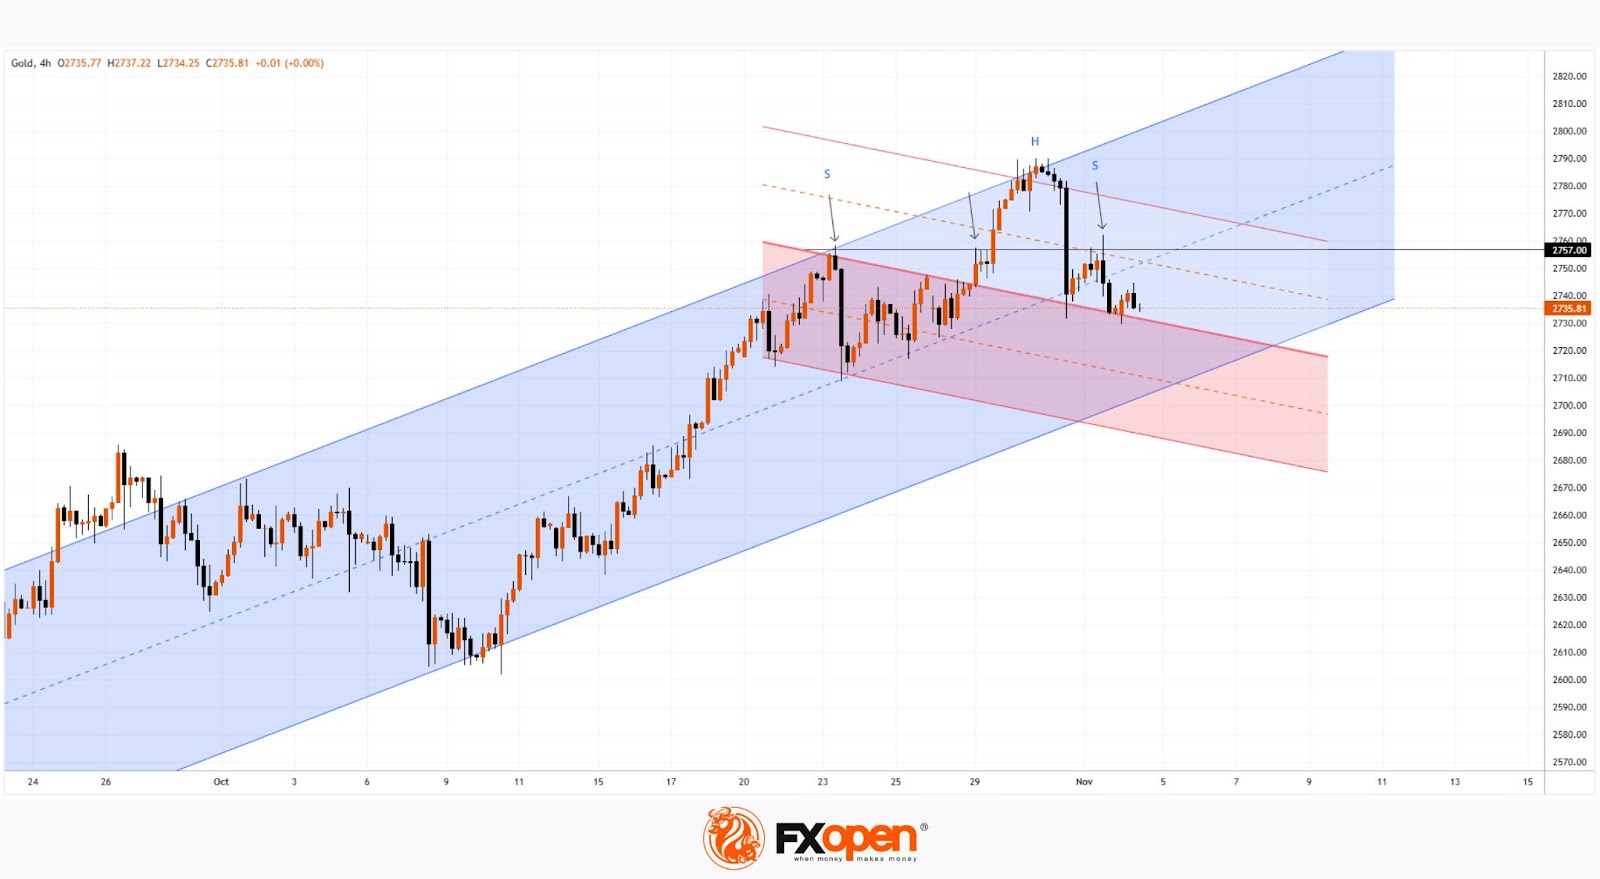
Today, technical analysis of the XAU/USD chart shows several bearish signals, specifically:
→ Gold has moved into the lower half of the blue channel, crossing below its midpoint—indicating supply pressure;
→ The $2757 level has once again acted as resistance (marked with arrows);
→ A bearish "Head and Shoulders" pattern (SHS) is forming on the chart.
A central question for November will likely be whether bulls can keep the gold price within the ascending channel. The channel’s lower boundary may serve as a support level.
However, it’s possible that, with new developments in geopolitics and macroeconomics, the XAU/USD chart will continue to display price action within a more defined downward channel.
Start trading commodity CFDs with tight spreads (additional fees may apply). Open your trading account now or learn more about trading commodity CFDs with FXOpen.
This article represents the opinion of the Companies operating under the FXOpen brand only. It is not to be construed as an offer, solicitation, or recommendation with respect to products and services provided by the Companies operating under the FXOpen brand, nor is it to be considered financial advice.
Stay ahead of the market!
Subscribe now to our mailing list and receive the latest market news and insights delivered directly to your inbox.


Latest articles

Market Analysis: GBP/USD Dips Further As EUR/GBP Regains Traction
GBP/USD failed to climb above 1.3500 and corrected some gains. EUR/GBP started a decent increase and might aim for more gains above 0.8700.
Important Takeaways for GBP/USD and EUR/GBP Analysis Today
· The British Pound


Market Insights with Gary Thomson: Oil, US Retail Sales & NFP in Focus
In this video, we’ll explore the key economic events and market trends, shaping the financial landscape. Get ready for insights into financial markets to help you navigate the week ahead. Let’s dive in!
In this episode of Market