


FXOpen

Yesterday, fresh values of the CPI index were published, which testified to a moderate slowdown in inflation in the US. The actual value was 3.2% in annual terms (expected 3.3%, a month earlier = 3.0%, a year earlier = 9.1%).
In reaction to the news, the price of gold fell from a daily high around USD 1,930 an ounce to renew the August low. Such behavior can be interpreted as a decrease in the value of the precious metal, as it loses its relevance as a protective asset against inflation.
Earlier we wrote that August began for the gold market in a bearish way. The trend continues.
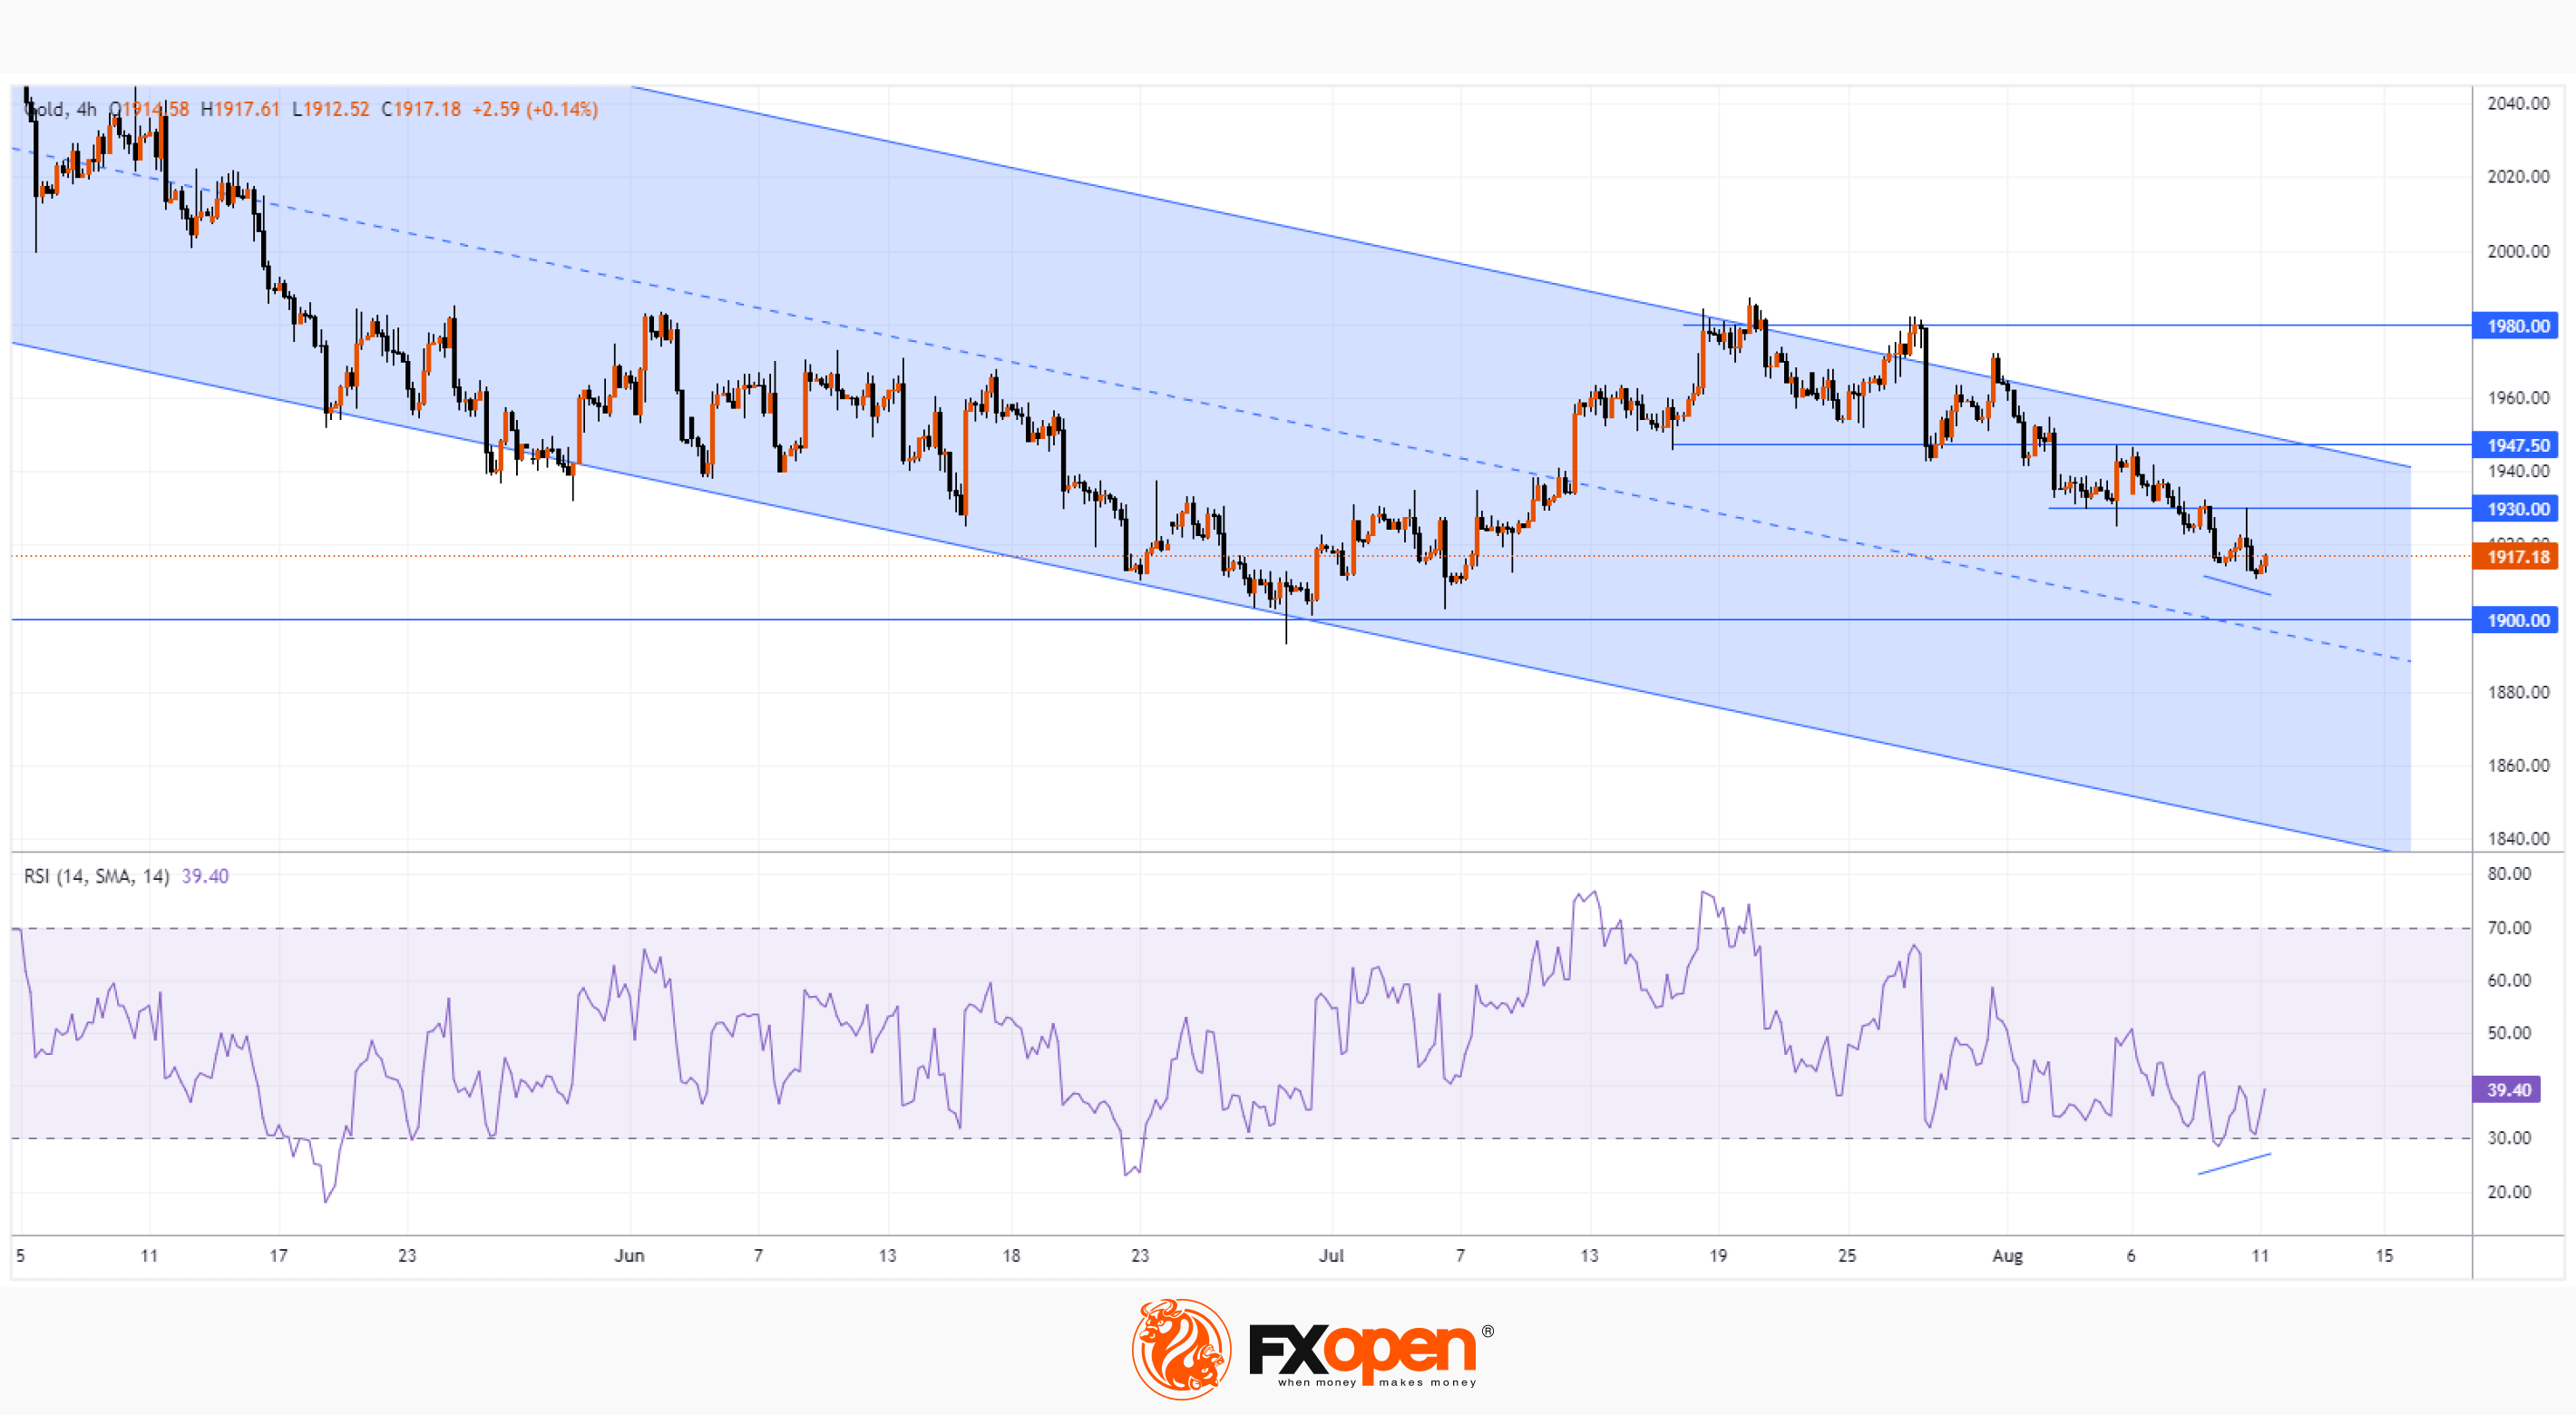
Technical analysis of the XAU/USD chart on the 4-hour timeframe shows that:
→ the price develops dynamics within the descending channel, which has been operating since May of this year;
→ yesterday there was a test of resistance at the level of USD 1,930, which served as support in early August. This is a bearish sign;
→ the price of gold is approaching an important support at the psychological level of USD 1,900 per ounce;
→ a series of lower highs is formed on the chart;
→ the RSI indicator rose from the oversold zone, forming a bullish divergence pattern.
It is reasonable to assume that when approaching psychological support, the bears in the gold market will lose confidence, and therefore rebounds are possible. But in order for them to develop into a sustainable rally, it will probably take the impact of important news.
Start trading commodity CFDs with tight spreads (additional fees may apply). Open your trading account now or learn more about trading commodity CFDs with FXOpen.
This article represents the opinion of the Companies operating under the FXOpen brand only. It is not to be construed as an offer, solicitation, or recommendation with respect to products and services provided by the Companies operating under the FXOpen brand, nor is it to be considered financial advice.
Stay ahead of the market!
Subscribe now to our mailing list and receive the latest market news and insights delivered directly to your inbox.


Latest articles

Consolidation Ahead of NFP: Commodity Currencies Search for Direction
Commodity-linked currencies have entered a consolidation phase following recent directional moves, as market participants adopt a wait-and-see approach ahead of key US labour market data. Current price action reflects a balance between ongoing demand for the US dollar and attempts

The Real Driver Behind the Dollar Rally: Market Insights with Gary Thomson
The US dollar has been firm, but the drivers behind the move may be more complex than they first appear.
While geopolitical tension and shifts in risk sentiment play a role, current price behaviour seems increasingly influenced by inflation expectations

EUR/USD and USD/CHF Pull Back: Market Reacts to Fundamentals
European currencies have shown a recovery in recent trading sessions after their recent decline, displaying early signs of a reversal. The US dollar is weakening amid expectations surrounding upcoming US macroeconomic data, while market participants are reassessing their short-term positions