


Market Analysis: Gold Starts August with a Sell-Off despite Bullish Headlines
FXOpen

Just yesterday gold was trading above USD 1,970, but this morning the XAU/USD price is already below 1,960. The decline comes amid bullish headlines in the media:
- According to Dow Jones, in the first half of 2023, the demand for gold from central banks reached a record level and amounted to 387 tons.
- According to JP Morgan analysts, the price of gold will reach USD 2,000 by the end of 2023 and reach new records in 2024 when interest rates start to fall.
- UBS analysts share the same opinion. They note that the price of gold may come under pressure from time to time, but investors should use price drawdowns below USD 1,950 per ounce to buy for the long term.
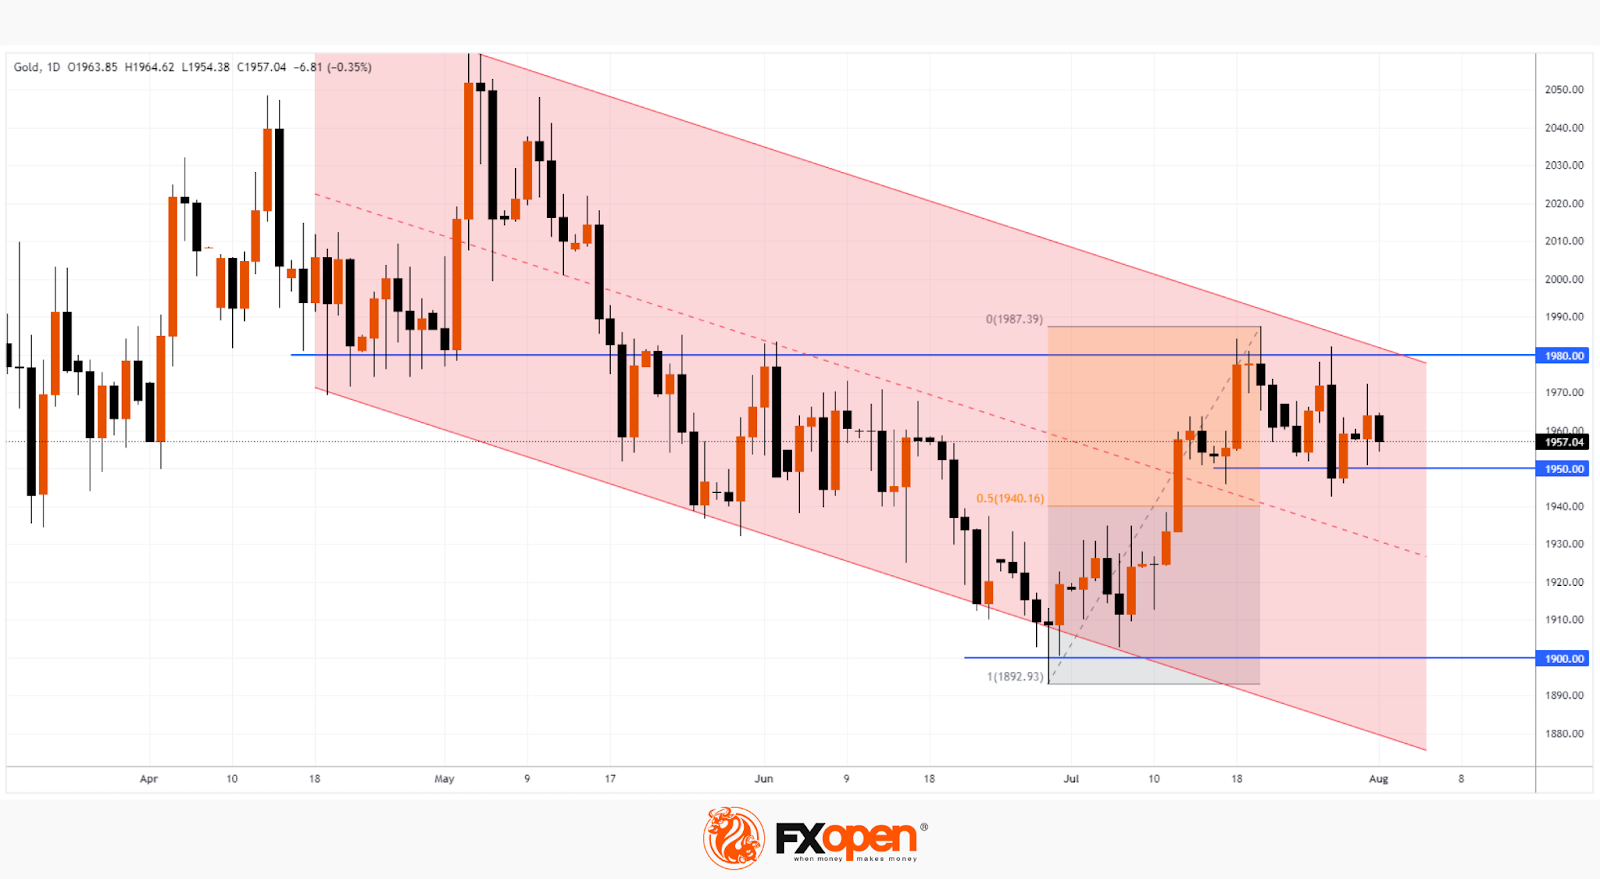
But despite the positive background in the media, August began in a bearish way for the gold market. The resistance block from the 1,980 level and the upper border of the descending channel looks powerful (shown in red).
Upcoming support levels:
- the psychological level of 1,950, from which the price of gold rebounded twice in July;
- the level of 1,940, corresponding to a 50% increase from the low to the high in July;
- median channel line.
Pay attention to the abundance of false breakouts of support and resistance levels on the XAU/USD chart.
Start trading commodity CFDs with tight spreads (additional fees may apply). Open your trading account now or learn more about trading commodity CFDs with FXOpen.
This article represents the opinion of the Companies operating under the FXOpen brand only. It is not to be construed as an offer, solicitation, or recommendation with respect to products and services provided by the Companies operating under the FXOpen brand, nor is it to be considered financial advice.
Stay ahead of the market!
Subscribe now to our mailing list and receive the latest market news and insights delivered directly to your inbox.


Latest articles

Weekly Market Insights with Gary Thomson: The Week of Central Banks and Earnings
In this video, we’ll explore the key economic events and market trends, shaping the financial landscape. Get ready for insights into financial markets to help you navigate the week ahead. Let’s dive in!
In this episode of Market

Intel at a Crossroads: Earnings Beat Meets Technical Resistance
Intel has just delivered its strongest quarter in over fifteen years, and the market reaction says it all. Q2 2026 revenue surged 25% year-over-year to $16.1 billion, crushing the consensus estimate of $14.42 billion, while adjusted EPS of

Tesla: Complex Range Structure Breaks Down Following Quarterly Earnings
Tesla released its Q2 2026 results after the market closed on 22 July. Revenue increased 26% year-on-year to $28.24 billion, while vehicle deliveries reached a record 480,126 units. However, operating margin fell sharply to 1.4%, down from