


FXOpen

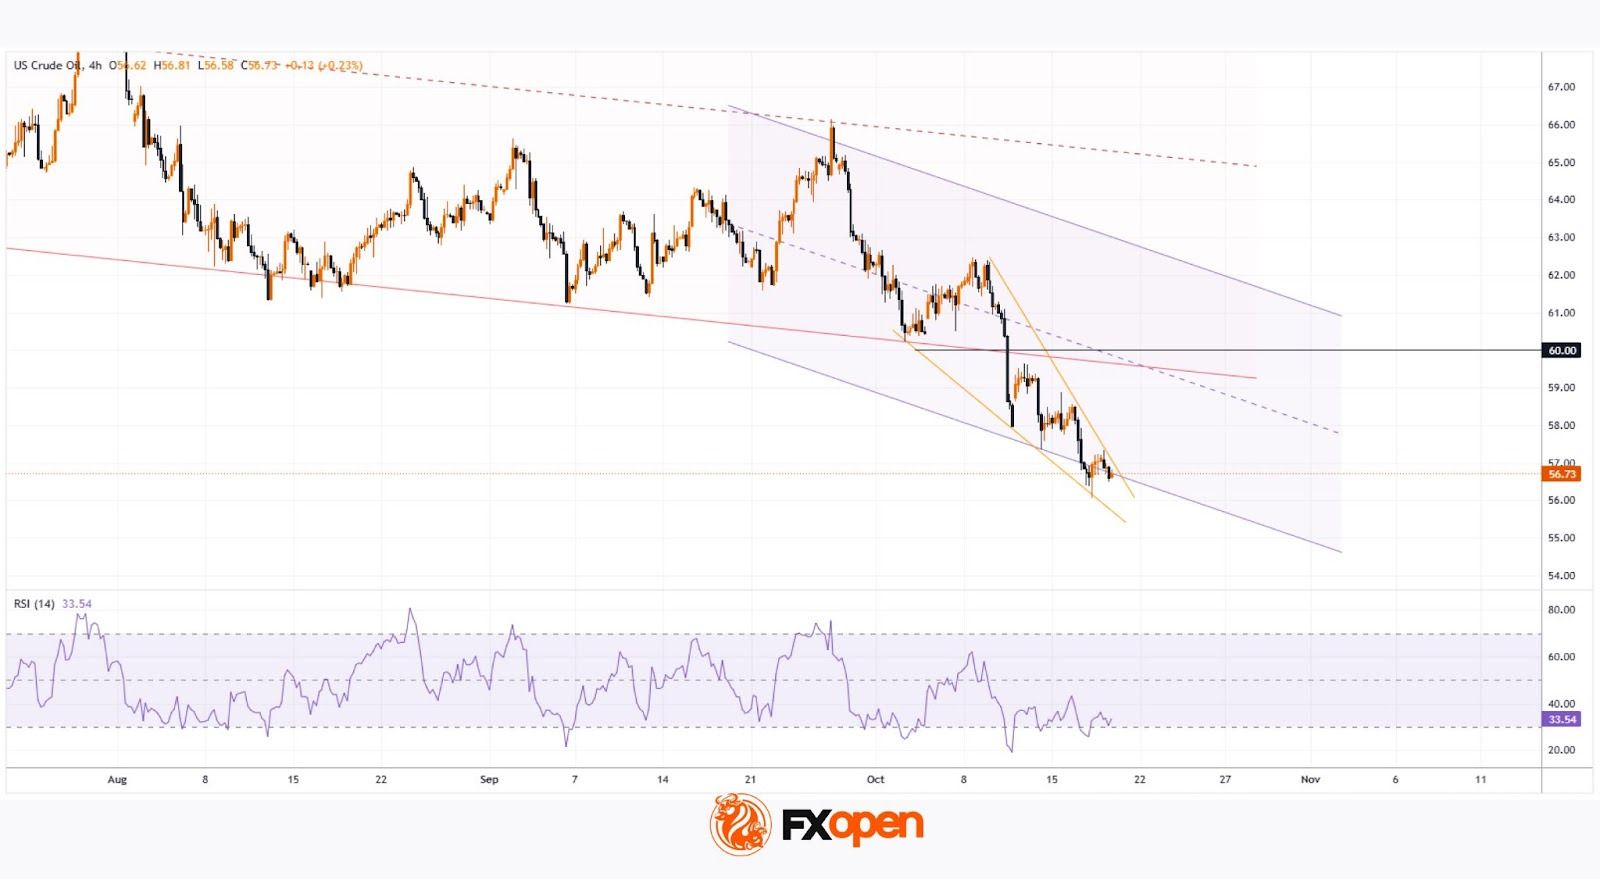
As shown on the XTI/USD chart, WTI crude is trading below $57 today, with the 2025 low sitting near $55. Several factors are currently weighing on oil prices:
→ Uncertainty surrounding the US-China trade deal — the world’s two largest oil consumers — continues to cloud the outlook for global growth and crude demand.
→ Increased output from OPEC+ members has added further pressure, with the IEA last week raising its forecast for a global oil surplus.
→ A decline in the risk premium following the peace agreement in the Middle East has also reduced support for oil prices.
So, what could happen next?
Technical Analysis of the XTI/USD Chart
Seven days ago, we noted that:
→ In the long-term context, oil price fluctuations — following the June escalation in the Middle East — have formed a downward channel (shown in red). The current price has now slipped below its lower boundary.
→ In the short term, the pace of the decline appears to be accelerating, highlighted by the purple trajectory lines.
At that time, we suggested a scenario in which WTI could drift towards its yearly low near $55, which is now materialising. However, note the following:
→ The RSI indicator is hovering near oversold territory.
→ The chart shows signs of a Falling Wedge pattern, which often precedes a bullish reversal.
Given these signals, it is reasonable to assume that, after a roughly 10% decline since the start of the month, bears may begin locking in profits on short positions. This could trigger a technical rebound in WTI prices — potentially towards the resistance area defined by:
→ The lower boundary of the red channel;
→ The psychological level of $60;
→ The median line of the purple channel.
Start trading commodity CFDs with tight spreads (additional fees may apply). Open your trading account now or learn more about trading commodity CFDs with FXOpen.
This article represents the opinion of the Companies operating under the FXOpen brand only. It is not to be construed as an offer, solicitation, or recommendation with respect to products and services provided by the Companies operating under the FXOpen brand, nor is it to be considered financial advice.
Stay ahead of the market!
Subscribe now to our mailing list and receive the latest market news and insights delivered directly to your inbox.


Latest articles

Tesla (TSLA) Shares Surge Following Musk’s Announcements
According to the chart, Tesla (TSLA) shares had been under significant pressure since the start of 2026: from their December high, they had lost around 25% of their value. The main bearish drivers included:
→ Intense competition from Chinese automakers, particularly

XTI/USD Analysis: WTI Oil Prices Under Pressure from Trump’s Statements
Yesterday, following a false bullish breakout above the psychological $100 level, WTI crude prices fell sharply towards the $85 area. The primary driver of this rapid decline was comments made by the US President.
According to Donald Trump:
→ the United
