


Peercoin and Namecoin Back in Downtrend
FXOpen
Both Peercoin and Namecoin are back in a downtrend. In our last article we noted that both cryptos were pushing on important support levels. Late on Tuesday, these support levels finally broke, first on NMC and 3 hours later on PPC/USD.
Peercoin Breaks 40 Cents
Two days ago, Peercoin broke the important support near 40 cents at $0.398. Prices crashed soon after to $0.349 per coin. This is close to the January lows at $0.353. Since that crash we’ve somewhat stabilized but PPC is still far below the 40 cents mark at $0.374 right now.
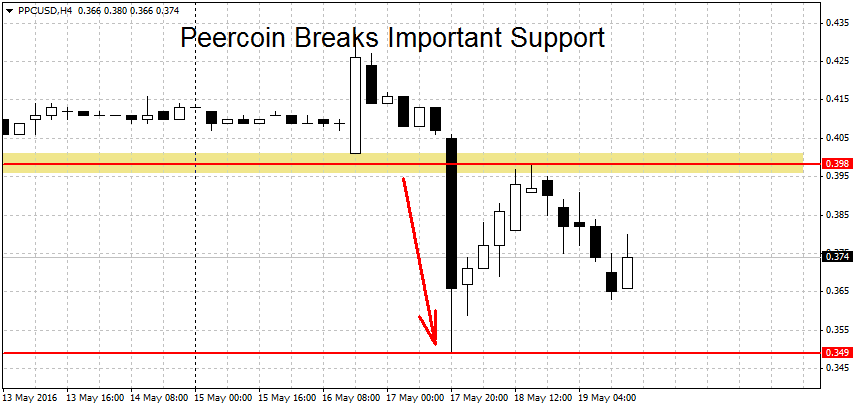
With the decisive break below $0.398 we’re now in a short-term downtrend. The medium-term trend has also switched to the downside. The longer (monthly) trend remains neutral.
Important support levels below the current prices can be found in the $0.349-$0.353 area followed by the round 30 cents level. Further down the August lows at $0.291 may also act as a barrier to the bears.
On the other end, a break above the $0.442 swing high would both end the downtrend and start a new short-term rally. Higher up we find more resistance at the $0.479 swing high followed by the round 50 cents level. We have more resistance levels on the upside at $0.544, $0.57 and $0.616 per coin.
Namecoin Enters Downtrend
Similar to Peercoin, thealternative cryptocurrency Namecoin entered a downtrend as well. Here the break of the support at $0.412 happened few hours earlier on Tuesday, with prices falling to a low of $0.385. Two hours later the crypto lost more ground as the sell-off in Peercoin started. A low of $0.352 was reached that day. Again similar to PPC, after that initial crash the prices have stayed relatively stable but well below the breakdown point.
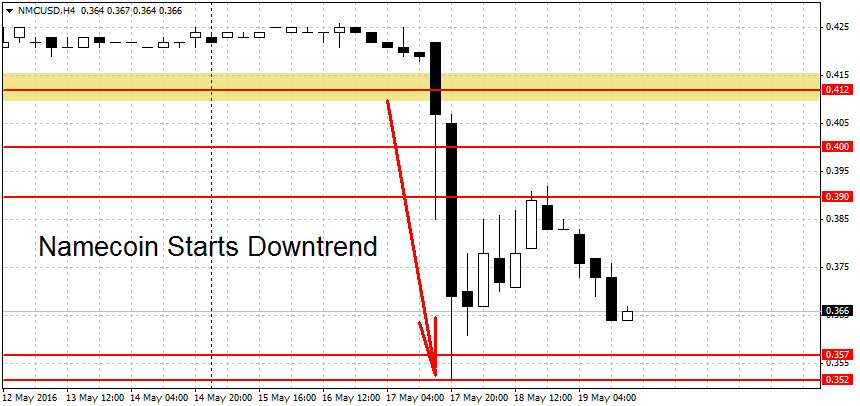
We’re now in a downtrend, both in the short-term and medium-term. The long-term trend is still undecided. The first support area for NMC/USD is between Tuesday’s low at $0.352 and the $0.357 swing low. Below here there’s a strong support at the double bottom formation near $0.332, followed by the swing low at $0.306.
On the upper end, a break of the $0.446 swing high would both end the current downmove and restart the bullish uptrend. Above here resistance can be found at the $0.50 round figure followed by the 54 cents level and the March high at $0.633. We find more levels to the upside at the November spike high of $0.666 and the former support (now turned resistance) at $0.751 per coin.
FXOpen offers the world's most popular cryptocurrency CFDs*, including Bitcoin and Ethereum. Floating spreads, 1:2 leverage — at your service (additional fees may apply). Open your trading account now or learn more about crypto CFD trading with FXOpen.
*Important: At FXOpen UK, Cryptocurrency trading via CFDs is only available to our Professional clients. They are not available for trading by Retail clients. To find out more information about how this may affect you, please get in touch with our team.
This article represents the opinion of the Companies operating under the FXOpen brand only. It is not to be construed as an offer, solicitation, or recommendation with respect to products and services provided by the Companies operating under the FXOpen brand, nor is it to be considered financial advice.
Stay ahead of the market!
Subscribe now to our mailing list and receive the latest market news and insights delivered directly to your inbox.


Latest articles

US Dollar Strengthens Amid Equity Market Weakness and Hawkish Fed Rhetoric
The US dollar continues to hold firm near multi-year highs as sentiment across equity markets deteriorates and investors increasingly expect the Federal Reserve to maintain a restrictive monetary policy stance for longer. The US economy remains resilient, while inflation risks

Bitcoin: Corrective Channel Broken as Traders Turn More Active
Bitcoin has come under the influence of several factors simultaneously. The wave of selling at the beginning of June was linked to Strategy's first disclosed Bitcoin sale in several years, a prolonged series of outflows from spot ETFs, and a

DAX 40: consolidation amid technology sell-off
A wave of selling in the technology sector that emerged earlier this week has weighed on European equities. The trigger was investor concern over the profitability of large-scale debt-funded investments by major US tech companies in AI infrastructure. The Nasdaq