


Peercoin and Namecoin Give Up Some Gains
FXOpen
Both Peercoin and Namecoin are trading lower compared to two weeks ago. Peercoin is at $0.611 right now, down by almost 12 percent, while NMC is down by a much larger 22 percent.
Peercoin Loses Some Gains
Peercoin lost some of the gains made during the rally. Prices fell from a high of $0.863 on March 16th to a low of $0.48 just a few days later. From here we stabilized somewhat and we’ve been trading mostly range-bound around 50-60 cents per coin.
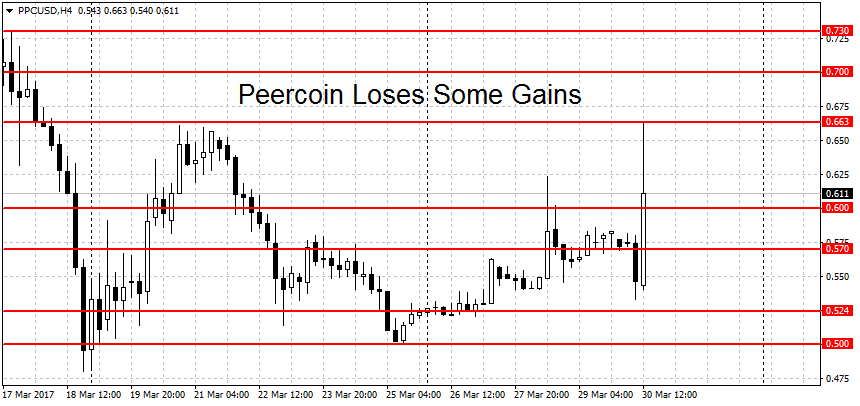
Today we saw a spike to $0.663 that was quickly retraced. This was likely caused by the large gains in Litecoin today (LTC/USD almost doubled) so it’s unsure if the move higher will continue at the same pace. Nonetheless, the trend is still up and to end it the bears will need to make a decisive break below the $0.50 round figure.
Support below here can be found at $0.48, followed by the 40 cents round level. Further down we find a cluster of potential support levels at $0.337, $0.35, $0.374 and $0.388. A clearing of this area would lead to more PPC losses. On the longer-term weekly charts, the trend is bullish as well. The monthlies are still signaling indecision at current prices.
Namecoin Down by 22 Percent
Namecoin is down by 22 percent compared to two weeks ago. We are currently quoted at $0.646 dollars per coin. If measured from the latest swing high, the losses total over 31 percent.
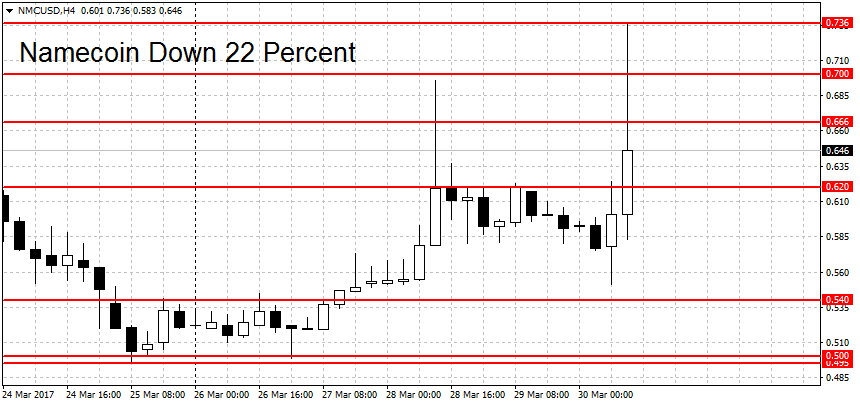
However, the tentative trend upward is still in place. To end the rally, the bears need a break below $0.495. As usual with these levels, we’re looking for a decisive break not just a brief shallow spike below the support. More support below can be found at the former $0.292 swing high, the 30 cents round figure and the September resistance (now turned support) at $0.32 dollars. A clearing of these levels would start a new downtrend in NMC/USD.
On the upside, we have several weaker resistance levels at $0.666, $0.70 and finally at $0.736, today’s spike high. Further up the $1 parity level is a tested resistance. Prices topped out here earlier this month (at $0.985 to be exact). The two-year high at $1.30 dollars is another potential resistance level.
On the longer-term charts NMC is in a similar boat as PPC. Prices are bullish on the weekly but neutral on the monthly charts.
FXOpen offers the world's most popular cryptocurrency CFDs*, including Bitcoin and Ethereum. Floating spreads, 1:2 leverage — at your service (additional fees may apply). Open your trading account now or learn more about crypto CFD trading with FXOpen.
*Important: At FXOpen UK, Cryptocurrency trading via CFDs is only available to our Professional clients. They are not available for trading by Retail clients. To find out more information about how this may affect you, please get in touch with our team.
This article represents the opinion of the Companies operating under the FXOpen brand only. It is not to be construed as an offer, solicitation, or recommendation with respect to products and services provided by the Companies operating under the FXOpen brand, nor is it to be considered financial advice.
Stay ahead of the market!
Subscribe now to our mailing list and receive the latest market news and insights delivered directly to your inbox.


Latest articles

EUR/USD and GBP/USD consolidate ahead of the Fed decision
European currencies are showing subdued dynamics, entering a consolidation phase following their previous advance. Earlier, EUR/USD and GBP/USD broke out of their ranges and strengthened; however, the subsequent correction has led both pairs to retest the previously breached

Meta: V-Shaped Recovery Meets Heavy Volume Resistance
The movement in Meta Platforms shares is being driven by two competing narratives. On one hand, advertising revenue is benefiting from AI-based tools: the Advantage+ platform continues to support strong advertiser demand, and the analyst consensus for Q1 2026 revenue

Commodity Currencies Test Key Levels Ahead of Major Macro Data
Commodity-linked currencies are trading near key levels, showing restrained price action as market participants adopt a wait-and-see approach. The fundamental backdrop is shaped by expectations surrounding the release of Australia’s inflation data and the Bank of Canada’s interest