


Peercoin and Namecoin Stay Flat
FXOpen
The past week has been uneventful for both Peercoin and Namecoin. Compared to our last update, PPC/USD is up less than 1 cent while Namecoin is up by only 0.4 cents. The overall crypto market has been undecided for weeks now as bitcoin trading grinds to a halt.
Peercoin Stays Flat
With the rally in Peercoin prices now behind us, PPC spent last week tucked inside a range. The high reached stands at $0.311 and the low is at $0.274. We are currently quoted at $0.29 flat.
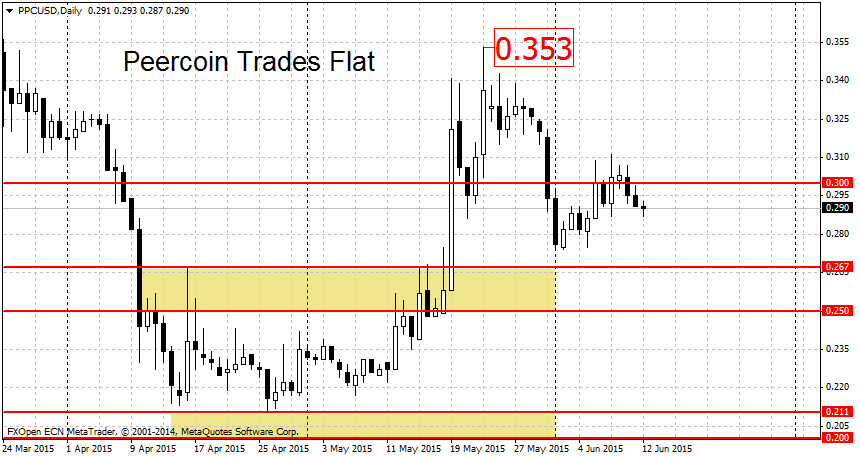
To restart the rally,we will need to see prices head back above the $0.353 swing high. The previous resistance area, where we brokeout to the upside, goes from $0.25 to $0.263 and may provide support to falling prices. But if the bears manage to decisively break below 25 cents, PPC would enter a downtrend. Below here, important support can be found at the double bottom at 21 cents.
Namecoin Continues Range
Alternative cryptocurrency Namecoin continues to trade in a range. In the past 7 days, the total range has been a tiny 1.4 cents or around 4.5 percent. This compares to an average of 8 cents for the weekly 20 period ATR. Going further back, volatility was several magnitudes higher with the 20-week ATR printing values above 15 cents.
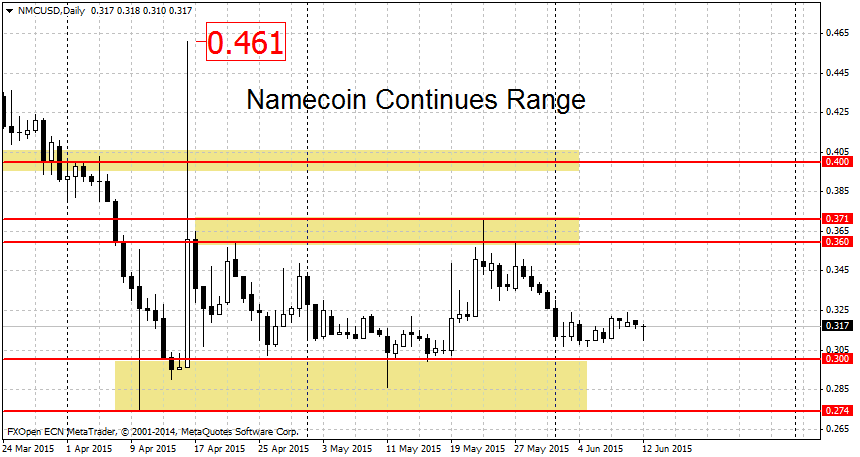
With no major movements, the important support and resistance levels for NMC remain the same. We have a range between $0.274 and $0.371. Prices will need to breakout beyond these bounds to jump-start a new rally/downtrend. On the lower end the double bottom formation near $0.27 will be very important. If the bears make a decisive break below 27 cents we will start a new downtrend.
On the higher end,the area from swing high at 36 cents to the new high at $0.371 will be the resistance to watch. A clean breakout above this level should trigger a new rally in prices. Important levels above here can be found at $0.40, followed by the April 16th high at $0.461.
Bitcoin Slightly Up
Bitcoin has been trading slightly up in the past few days. We are currently quoted at $231.80, after an earlier unsuccessful attempt to break $232. A clean break above $232, preferably over today’s high at $233.09 as well, would end the downtrend. But to start a new rally, the bulls have a much bigger hurdle at $250 dollars per coin. On the lower end, a move below the June 2nd swing low at $222 would rejuvenate the downtrend.
FXOpen offers the world's most popular cryptocurrency CFDs*, including Bitcoin and Ethereum. Floating spreads, 1:2 leverage — at your service (additional fees may apply). Open your trading account now or learn more about crypto CFD trading with FXOpen.
*Important: At FXOpen UK, Cryptocurrency trading via CFDs is only available to our Professional clients. They are not available for trading by Retail clients. To find out more information about how this may affect you, please get in touch with our team.
This article represents the opinion of the Companies operating under the FXOpen brand only. It is not to be construed as an offer, solicitation, or recommendation with respect to products and services provided by the Companies operating under the FXOpen brand, nor is it to be considered financial advice.
Stay ahead of the market!
Subscribe now to our mailing list and receive the latest market news and insights delivered directly to your inbox.


Latest articles

EUR/USD Eyes Gains As USD/CHF Weakness Deepens Again
EUR/USD started a fresh increase above 1.1700 and 1.1720. USD/CHF declined further and is now struggling below 0.7835.
Important Takeaways for EUR/USD and USD/CHF Analysis Today
· The Euro started a decent increase from

Apple: Earnings Day Above the Activity Zone
On 30 April, after the market close, Apple Inc. will release its financial results for the second quarter of fiscal 2026. The consensus forecast, based on estimates from 31 analysts, points to revenue of around $109.7 billion, with expected

USD/JPY and USD/CHF Near Key Levels: The Dollar Supported by the Fed
The US dollar continues to trend upwards following the Federal Reserve meeting, drawing support from the regulator’s moderately hawkish stance and comments by Jerome Powell. Markets interpret the Fed’s rhetoric as a signal that restrictive policy is likely