


Peercoin Ends Downtrend, Namecoin Still Weak
FXOpen
Unlike the past two months where we saw both Peercoin and Namecoin fall together, during the last two weeks a divergence has emerged. Namecoin continues to drop, albeit at a slower pace, and is now down by 7.4% during the previous 14-day period. Peercoin on the other hand is up by over 10 percent during the same time-frame.
Namecoin Still Weak
A 19.4% jump on November 13th came close to ending the downtrend for Namecoin. Prices rallied as high as $0.246 but narrowly missed the 26 cents threshold. However in the days after those gains evaporated and NMC/USD now finds itself again under pressure. One coin is selling for $0.212 right now, 1.7 cents or 7.4 percent below the price noted two weeks ago.
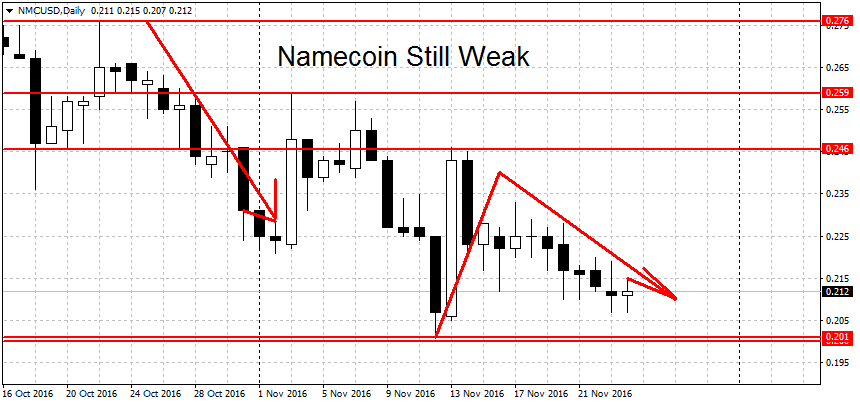
The downtrend remains in place. To end it, the bulls will have to push the pair above the $0.246 swing high. Above here more resistance can be found at the $0.257 – $0.259 area. A decisive clearing of this area could start a new NMC uptrend. Higher still we have more resistance at $0.276 swing high and the $0.30 round figure.
On the other end we have support at this month’s low of $0.201 closely followed by the 20 cents round level. Below here it’s hard to see any notable levels until this year’s spike low at $0.153. This is also a multi-year low for NMC/USD. A break below here could extend the losses. All three trends for Namecoin, short-term, medium-term and long-term, are pointing down.
Peercoin Downtrend Ends
The downtrend for PPC/USD officially ended on November 13th when we got an almost 20 percent surge in prices, from $0.232 to a high of $0.277 dollars. The gains recorded on that day failed to stick however. We’re now quoted at $0.258, ‘only’ 10 percent higher compared to two weeks ago.
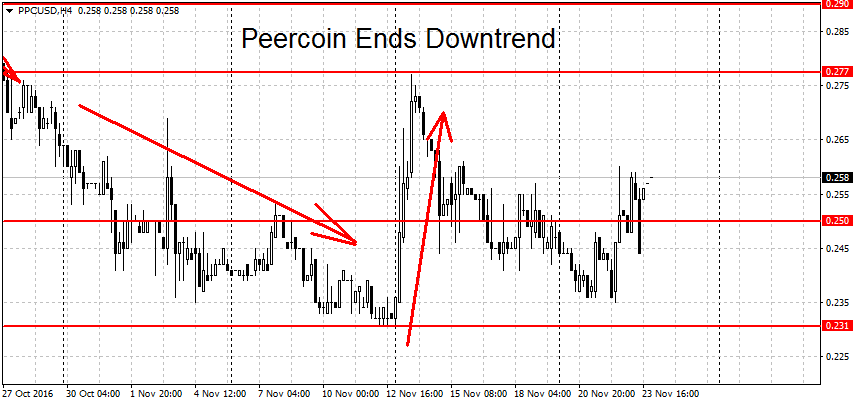
Peercoin is now in ‘no man’s land’. A new rally requires a breakout above the November highs at $0.277 dollars. Higher up we find resistance at the $0.29 swing high, closely followed by the 30 cents round figure. A new downtrend on the other hand need a move below this month’s low at $0.231. Below here there’s support at the $0.211 swing low, closely followed by the $0.20 round level. The $0.211 low is a multi-year low for PPC/USD.
The trends for NMC/USD are mixed at the moment. On the short-term charts there is no clear trend. This is the case on the long-term charts as well. On the medium, weekly charts, the trend is bearish.
FXOpen offers the world's most popular cryptocurrency CFDs*, including Bitcoin and Ethereum. Floating spreads, 1:2 leverage — at your service (additional fees may apply). Open your trading account now or learn more about crypto CFD trading with FXOpen.
*Important: At FXOpen UK, Cryptocurrency trading via CFDs is only available to our Professional clients. They are not available for trading by Retail clients. To find out more information about how this may affect you, please get in touch with our team.
This article represents the opinion of the Companies operating under the FXOpen brand only. It is not to be construed as an offer, solicitation, or recommendation with respect to products and services provided by the Companies operating under the FXOpen brand, nor is it to be considered financial advice.
Stay ahead of the market!
Subscribe now to our mailing list and receive the latest market news and insights delivered directly to your inbox.


Latest articles

DAX 40: consolidation amid technology sell-off
A wave of selling in the technology sector that emerged earlier this week has weighed on European equities. The trigger was investor concern over the profitability of large-scale debt-funded investments by major US tech companies in AI infrastructure. The Nasdaq

Euro Hits Fresh Yearly Lows Amid Dovish ECB Signals
The euro remains under pressure following weak macroeconomic data from the euro area and fresh signals that the European Central Bank is prepared to maintain a more accommodative monetary policy stance. Data released yesterday pointed to a deterioration in business

Pound at Key Levels: Markets Assess Impact of Political Uncertainty in the UK
The British pound remains under pressure following increased political uncertainty in the United Kingdom triggered by the Prime Minister’s resignation. Investors are assessing potential shifts in the political and economic policy outlook after the head of government stepped down,