


Peercoin, Namecoin Continue to Sink
FXOpen
Both Peercoin and Namecoin are continuing their downtrends. Peercoin is down by over 7 percent this week while NMC/USD is trading lower by exactly 3 percent. Let’s start with PPC and we’ll get back to Namecoin later on.
Peercoin Down 7 Percent
Alternative cryptocurrency Peercoin is down by 7.2 percent compared to last Thursday. The altcoin has fallen from $0.374 dollars to $0.347 dollars right now.
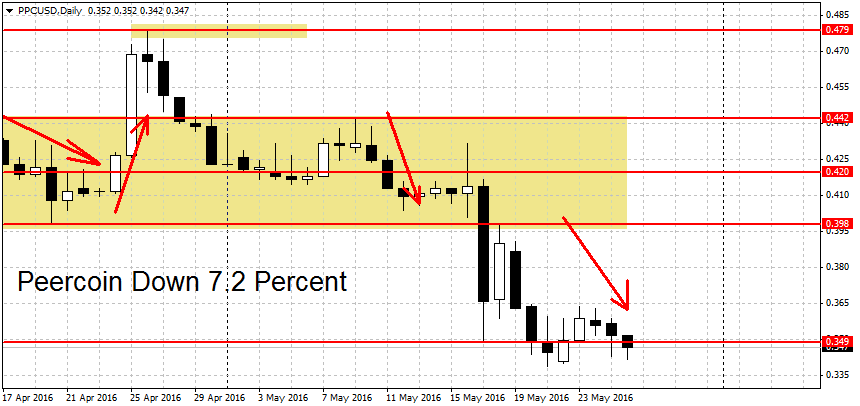
We are currently trading right at another important support level for PPC. As we noted last week, there is strong support area around $0.349-$0.353 dollars. This week prices dropped to $0.339 dollars but subsequently recovered. Today the lows were again tested, with PPC/USD bottoming out at $0.342 dollars. From here Peercoin again bounced back to $0.347 dollars right now. Because we are looking for a decisive break of these levels, we can’t call this support broken yet. A sustained move below $0.339 swing low should do the trick though.
Below here we find the next support area at the round 30 cents level. The August lows at $0.291 dollars could also act as support. Both the short-term and medium-term trends are now down for PPC/USD. The long-term trend is still undecided.
On the upside, move above the $0.42 dollars would end the current downtrend. A decisive breakout above the $0.442 swing high could start a new PPC rally. Higher up we find resistance at the $0.479 swing high followed by the round 50 cents level. We have more resistance levels at $0.544, $0.57 and $0.616 dollars per coin.
Namecoin Slightly Down
Namecoin is trading down by 3 percent this week, from $0.366 to $0.355 dollars right now.
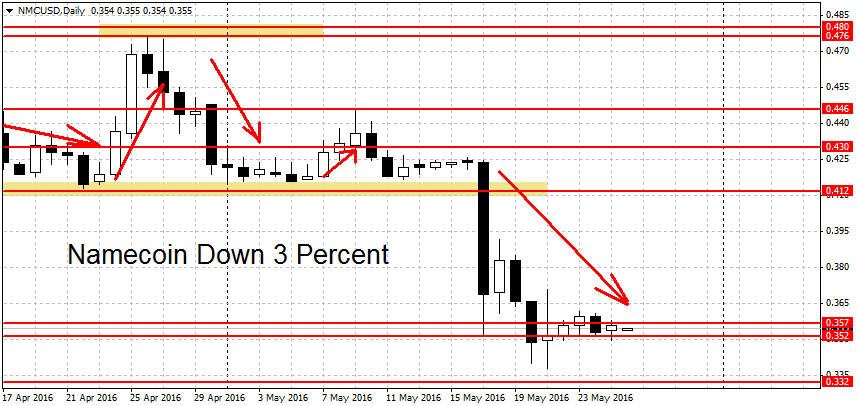
Last week we penned the first support area between last Tuesday’s low at $0.352 and the $0.357 swing low. This week a low of $0.338 dollars was hit, close to the $0.332 dollars swing low. This is an important point for NMC because there is strong support here from a former double bottom formation. The next support level after this can be found at the $0.306 dollars swing low, followed by the round $0.30 level.
Similarly to Peercoin, for NMC/USD both the short-term and medium-term trends are down while the long-term trend is neutral.
On the upside, a move above the $0.43 level would end the current downmove. A breakout of the $0.446 swing high could restart the bullish uptrend. Above here resistance levels can be found at the $0.476 swing low and the $0.50 round figure. These are followed by the 54 cents level and the March high at $0.633 dollars. The November highs at $0.666 could also act as resistance, at least temporarily.
FXOpen offers the world's most popular cryptocurrency CFDs*, including Bitcoin and Ethereum. Floating spreads, 1:2 leverage — at your service (additional fees may apply). Open your trading account now or learn more about crypto CFD trading with FXOpen.
*Important: At FXOpen UK, Cryptocurrency trading via CFDs is only available to our Professional clients. They are not available for trading by Retail clients. To find out more information about how this may affect you, please get in touch with our team.
This article represents the opinion of the Companies operating under the FXOpen brand only. It is not to be construed as an offer, solicitation, or recommendation with respect to products and services provided by the Companies operating under the FXOpen brand, nor is it to be considered financial advice.
Stay ahead of the market!
Subscribe now to our mailing list and receive the latest market news and insights delivered directly to your inbox.


Latest articles

DAX 40: consolidation amid technology sell-off
A wave of selling in the technology sector that emerged earlier this week has weighed on European equities. The trigger was investor concern over the profitability of large-scale debt-funded investments by major US tech companies in AI infrastructure. The Nasdaq

Euro Hits Fresh Yearly Lows Amid Dovish ECB Signals
The euro remains under pressure following weak macroeconomic data from the euro area and fresh signals that the European Central Bank is prepared to maintain a more accommodative monetary policy stance. Data released yesterday pointed to a deterioration in business

Pound at Key Levels: Markets Assess Impact of Political Uncertainty in the UK
The British pound remains under pressure following increased political uncertainty in the United Kingdom triggered by the Prime Minister’s resignation. Investors are assessing potential shifts in the political and economic policy outlook after the head of government stepped down,