


Peercoin, Namecoin Higher in Volatile Week
FXOpen
Peercoin Higher After Volatile Week
Alternative cryptocurrency Peercoin is trading somewhat higher this week. The altcoin has been buoyed by bitcoin’s rally but cracks are already starting to show. Since our last update on Thursday, PPC/USD gained 12.5 cents, or just over 25 percent and hit a high of $0.616 yesterday. But right as bitcoin’s move higher stalled, PPC rolled over, crashing by 10.3 cents to $0.513. We are currently quoted at $0.521, not far from the lows.
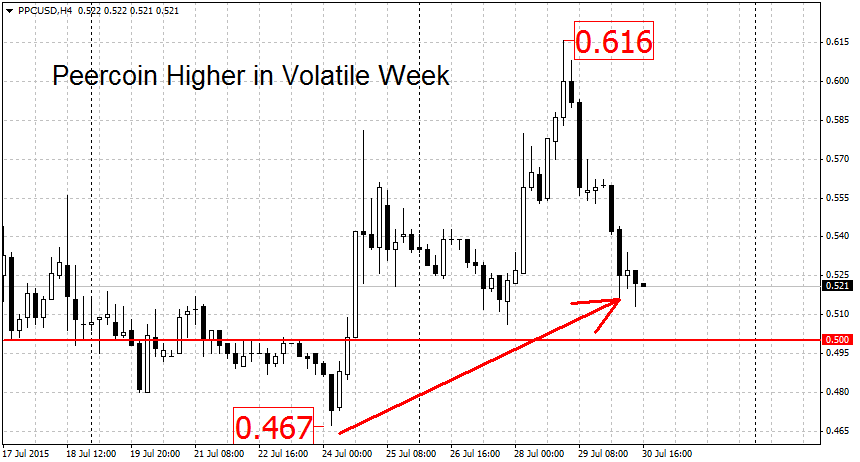
After the sizable move higher and the equally large crash, we’re now trading not far from where we left things last Thursday. Most of the technical levels remain unchanged. Some support can be found at the 50 cents round level. But a more important level can be found slightly lower at 46 cents. A decisive break below the $0.465 swing low would start a new downtrend. Further down, more support can be found at $0.376, followed by the round $0.30 mark. To the upside, yesterday’s high at $0.616 may act as weak resistance. But a break above the $0.738 swing high is needed to signal a new rally. This looks like a long shot from where we’re standing right now.
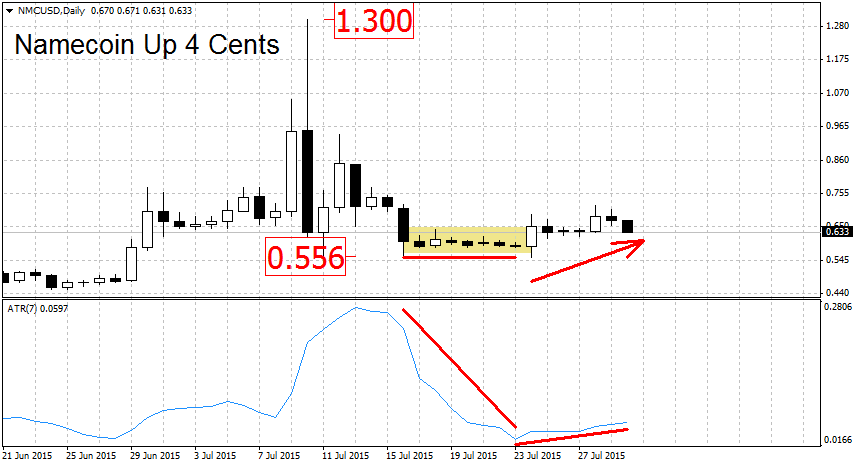
Namecoin Up 7 Percent
Namecoin is trading higher by 4.3 cents, or 7 percent. The crypto had a similar bitcoin inspired rally as Peercoin. But as soon as BTC stopped the gains, NMC/USD fell substantially. We are currently quoted at $0.633 dollars per coin.
What’s next for NMC? The levels to watch are $0.555 on the downside and $0.941 on the upside. Of the two, the $0.555 mark is more important because it’s a more defined level. This is a triple bottom, the sellers tried to break it on three separate occasions: July 11th, July 16th and July 24th. In all 3 cases, they were quickly repelled. But with each retest of the level, the odds increase that we will see a break lower. A decisive move below 55 cents would start a new downtrend and open the door to the round $0.50 level.
Below here we find an important support area stretching from the swing low at $0.453 to the April 16th swing high at $0.461. A clean move lower could open the door to the 37 cents handle. On the upper side, the bar to start a new rally is set much higher at $0.941. Reaching this level in the near future seems unlikely unless NMC gets a lot of help from bitcoin.
On the chart above we can see that volatility, as measured by the 7-day ATR, has picked up somewhat after last week’s lull. This is probably due to the bitcoin move higher from $270 to $290 dollars per coin. This had a knock-on rally effect in the altcoin market.
FXOpen offers the world's most popular cryptocurrency CFDs*, including Bitcoin and Ethereum. Floating spreads, 1:2 leverage — at your service (additional fees may apply). Open your trading account now or learn more about crypto CFD trading with FXOpen.
*Important: At FXOpen UK, Cryptocurrency trading via CFDs is only available to our Professional clients. They are not available for trading by Retail clients. To find out more information about how this may affect you, please get in touch with our team.
This article represents the opinion of the Companies operating under the FXOpen brand only. It is not to be construed as an offer, solicitation, or recommendation with respect to products and services provided by the Companies operating under the FXOpen brand, nor is it to be considered financial advice.
Stay ahead of the market!
Subscribe now to our mailing list and receive the latest market news and insights delivered directly to your inbox.


Latest articles

Weekly Market Insights with Gary Thomson: The Week of Central Banks and Earnings
In this video, we’ll explore the key economic events and market trends, shaping the financial landscape. Get ready for insights into financial markets to help you navigate the week ahead. Let’s dive in!
In this episode of Market

Intel at a Crossroads: Earnings Beat Meets Technical Resistance
Intel has just delivered its strongest quarter in over fifteen years, and the market reaction says it all. Q2 2026 revenue surged 25% year-over-year to $16.1 billion, crushing the consensus estimate of $14.42 billion, while adjusted EPS of

Tesla: Complex Range Structure Breaks Down Following Quarterly Earnings
Tesla released its Q2 2026 results after the market closed on 22 July. Revenue increased 26% year-on-year to $28.24 billion, while vehicle deliveries reached a record 480,126 units. However, operating margin fell sharply to 1.4%, down from