


Peercoin, Namecoin Pushing on Support
FXOpen
Both Peercoin and Namecoin are pushing on their respective support levels. For PPC/USD this figure stands around $0.398 while for NMC its around $0.412. As we always say, we’re looking for a ”decisive” break of these levels, not just a quick and shallow spike below.
Peercoin Down by 2.6 Percent
Peercoin is down by 2.6% this week, from $0.417 to $0.406 right now. Earlier in the day we hit a low of $0.404 but we’ve since bounced slightly. The important support around the 40 cents area at $0.398 dollars wasn’t tested this week.
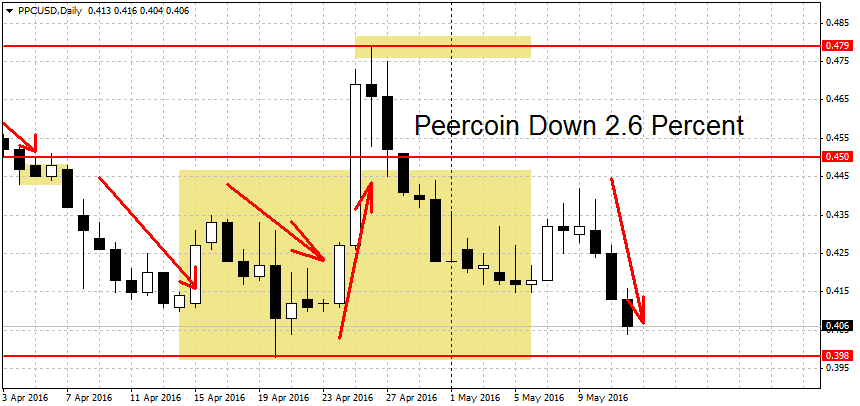
It remains the key level going forward. A clean break below it could start a new short-term trend to the downside. Close-by we find a strong support at $0.385 dollars. A break below here could lead to more gains toward the January lows for Peercoin at $0.353 dollars. The medium-term trend is neutral while the longer-term trend (monthly charts) is down.
On the other end, we’re looking at the $0.479 dollars swing high as a potential trend starter. Above it we have resistance at the round 50 cents level, followed by the $0.544 swing high. Further up we have two more resistance levels at $0.57 and $0.616 dollars per coin.
Namecoin Pushing on Support
Alternative cryptocurrency Namecoin continues to push on support. The level to watch is $0.412 dollars per coin. This week we got as low as $0.417 dollars. On the chart below we can see that every spike higher has been sold into by the bears, slowly pushing the pair back to the support area.
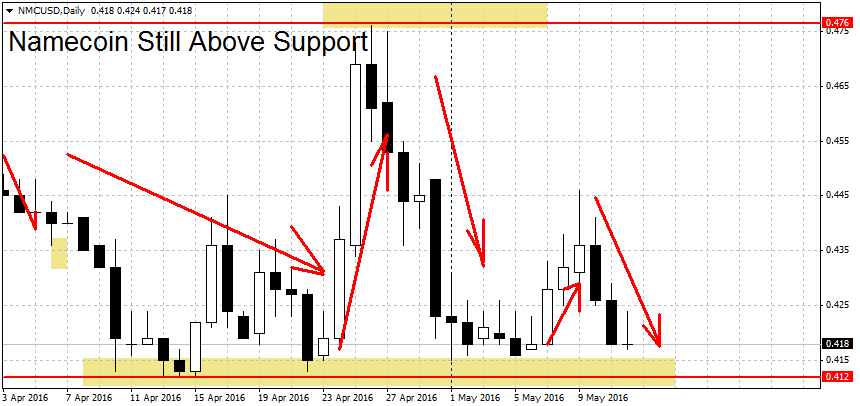
In the short-term technically NMC/USD is still in an uptrend. The medium-term trend for NMC is neutral while the long-term trend is down.
But we’re very close to breaking the current rally and starting a new trend lower if $0.412 gives way. A clean departure from this area could open the door toward the $0.357 swing low. Below here we find more strong support at the double bottom formation near $0.332, followed by the swing low at $0.306 dollars.
On the upside, a break of the $0.479 swing high would restart the bullish momentum. Above here more resistance can be found at the $0.50 round figure followed by the 54 cents level. Further up we have the March high at $0.633 dollars and the November spike high at the devils number of $0.666. Support turns to resistance and the former support at $0.751 dollars may act as a lid on prices, at least temporarily.
FXOpen offers the world's most popular cryptocurrency CFDs*, including Bitcoin and Ethereum. Floating spreads, 1:2 leverage — at your service (additional fees may apply). Open your trading account now or learn more about crypto CFD trading with FXOpen.
*Important: At FXOpen UK, Cryptocurrency trading via CFDs is only available to our Professional clients. They are not available for trading by Retail clients. To find out more information about how this may affect you, please get in touch with our team.
This article represents the opinion of the Companies operating under the FXOpen brand only. It is not to be construed as an offer, solicitation, or recommendation with respect to products and services provided by the Companies operating under the FXOpen brand, nor is it to be considered financial advice.
Stay ahead of the market!
Subscribe now to our mailing list and receive the latest market news and insights delivered directly to your inbox.


Latest articles

Amazon Earnings: Does the Chart Already Know Something the Numbers Don't?
All eyes are on July 30, when Amazon reports Q2 2026 earnings, with Wall Street increasingly convinced the bar has been set too low. Consensus sees EPS near $1.82-$2.26 on roughly $197 billion in revenue, but the

WTI Analysis: Gap Breaks Short-Term Trend as Price Remains Trapped Between the POC and Profile Boundary
WTI crude oil plunged by more than 7% on 27 July 2026 after the US suspended a series of strikes against Iran over the weekend, raising hopes of a diplomatic solution and the reopening of shipping through the Strait of

US Dollar Index: A Defining Week for the King of the Markets
The dollar heads into a pivotal week trading near 101.80, just off a 15-month high, with the Fed's July 29 meeting standing as the clear focal point. Markets currently price roughly a 65% chance of a hold, though renewed