


Peercoin Resumes Uptrend After Hiccup
FXOpen
In our previous article we hypothesized that both Peercoin and Namecoin are in rally mode. Shortly after that article however we got a sharp correction in prices, which briefly broke below some important support levels (more on this below).
Peercoin Resumes Uptrend
The last two weeks saw a lot of volatility in PPC prices. First we fell to a low of $0.211 on January 7th, briefly breaking below the $0.223 level identified last week as a potential trend ender. But the break wasn’t decisive and if you take a look at the daily chart you can see that prices never closed below this level. Furthermore the duration of the trip below $0.223 was short, lasting only a few hours.
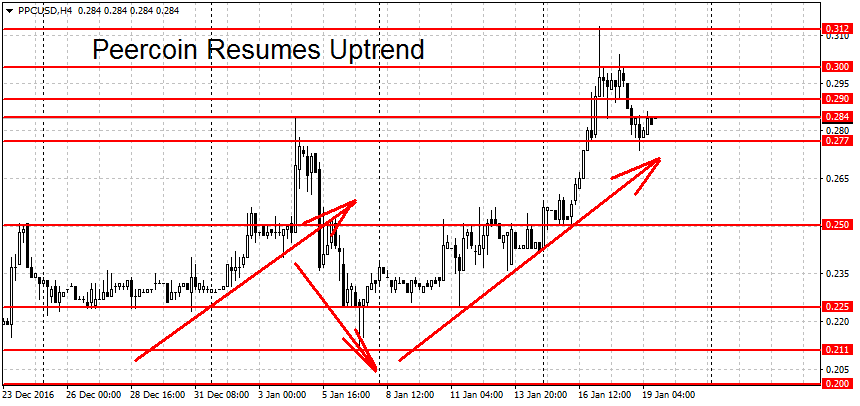
Because of the above we can say that the uptrend in PPC/USD is still in play. This week Peercoin hit new multi-month highs at $0.313. We have since fallen back somewhat to $0.282. On the longer-term charts (both weekly and monthly) PPC is in neutral mode.
On the way up, resistance can be found at former swing high at $0.29 and the 30 cents round level. But a stronger level then these two, at least on FXOpen, may be the $0.313 swing high reached few days ago. A breakout above here could intensify the gains.
On the lower end, a break below the $0.225 swing low is needed to end the current rally. As always, we are looking for a clean and decisive break, not a short spike below the level. A move below this month’s low at $0.211 would start a new PPC downtrend.
Namecoin Rally Ends
Namecoin prices initially followed a very similar pattern to PPC. Here too initially there was a sharp sell-off 12 days ago, with the pair bottoming out at $0.194. The level noted as a potential trend stopper in our previous NMC article was the $0.208 swing low. Clearly prices broke this level but they’ve failed to remain below it for long. In fact on the hourly chart we didn’t get a single candle close below $0.208.
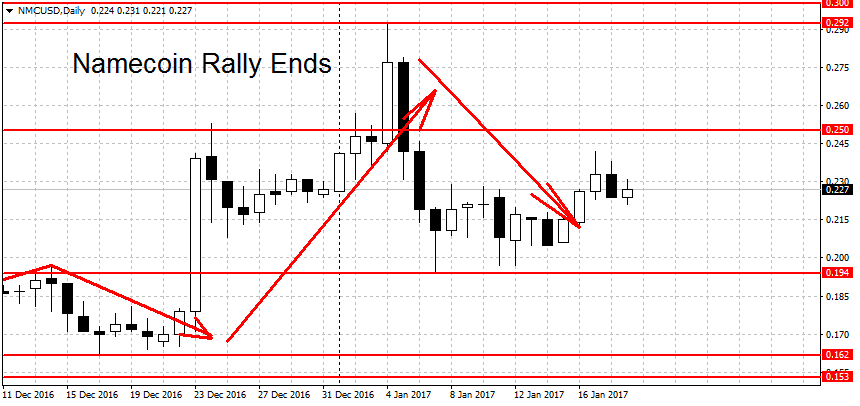
Here is where the similarities with Peercoin end. Unlike PPC, which recovered sharply after the initial decline, NMC failed to do so and lost the upward momentum entirely. We are now back in ‘no-mans’ land.
To start a new downtrend, the bears will have to push NMC/USD below $0.194 swing low. To resume the uptrend, prices will have to break above the 30 cents round figure. The longer-term charts for Namecoin are mixed. While the weekly is undecided, the monthly is still bearish.
FXOpen offers the world's most popular cryptocurrency CFDs*, including Bitcoin and Ethereum. Floating spreads, 1:2 leverage — at your service (additional fees may apply). Open your trading account now or learn more about crypto CFD trading with FXOpen.
*Important: At FXOpen UK, Cryptocurrency trading via CFDs is only available to our Professional clients. They are not available for trading by Retail clients. To find out more information about how this may affect you, please get in touch with our team.
This article represents the opinion of the Companies operating under the FXOpen brand only. It is not to be construed as an offer, solicitation, or recommendation with respect to products and services provided by the Companies operating under the FXOpen brand, nor is it to be considered financial advice.
Stay ahead of the market!
Subscribe now to our mailing list and receive the latest market news and insights delivered directly to your inbox.


Latest articles

DAX 40: consolidation amid technology sell-off
A wave of selling in the technology sector that emerged earlier this week has weighed on European equities. The trigger was investor concern over the profitability of large-scale debt-funded investments by major US tech companies in AI infrastructure. The Nasdaq

Euro Hits Fresh Yearly Lows Amid Dovish ECB Signals
The euro remains under pressure following weak macroeconomic data from the euro area and fresh signals that the European Central Bank is prepared to maintain a more accommodative monetary policy stance. Data released yesterday pointed to a deterioration in business

Pound at Key Levels: Markets Assess Impact of Political Uncertainty in the UK
The British pound remains under pressure following increased political uncertainty in the United Kingdom triggered by the Prime Minister’s resignation. Investors are assessing potential shifts in the political and economic policy outlook after the head of government stepped down,