


Peercoin, Namecoin Stay Range-Bound in September
FXOpen
Both Peercoin and Namecoin continued to trade within a range during September. Peercoin has been stuck in a 10 cents congestion area, between 32 and 42 cents. For Namecoin the range is a bit wider and extends from 33 to 46 cents per coin.
Peercoin Stuck in a 10 Cents Range
Alternative cryptocurrency Peercoin ended the last week of September same as the first one, stuck in a range. The top border of this congestion area is at the $0.422 swing high, while the bottom is at $0.321. We are currently quoted at $0.382 dollars for one Peercoin.
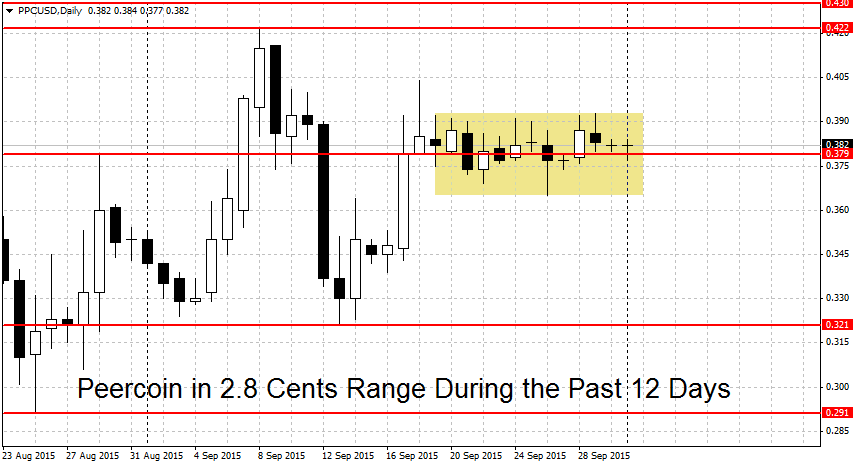
This range has been getting narrower. On the chart above we marked the most recent congested area, staring from September 19th to today. In the past twelve days now, PPC/USD stayed within a 2.8 cents range, between $0.365 and $0.393 dollars per coin. Note that these are not breakout bounds.
The important technical levels for Peercoin haven’t changed much. On the top side we have the 43 cents level. This level is important because the top of the current range stands at $0.422, while slightly above it we find important previous support at $0.43. Support turns to resistance and with prices now trading below the mark, the bulls may encounter significant push-back around this area. The confluence of these two levels should create a strong resistance. A breakout above this here could start a new PPC uptrend.
On the lower end, the key figure to watch is the 32 cents mark. This is a double bottom for Peercoin, hit on September 3rd at $0.324 and on September 13th at $0.321. A breakdown below here may re-start the downtrend. Further down we find the swing low reached during the previous downtrend at $0.291, another potential support level.
Namecoin Stuck in a Range
Namecoin, same as Peercoin, is still stuck in a range. The NMC range is a bit wider at 13 cents, with a low at $0.332 and a high at $0.463. We are currently trading at $0.371.
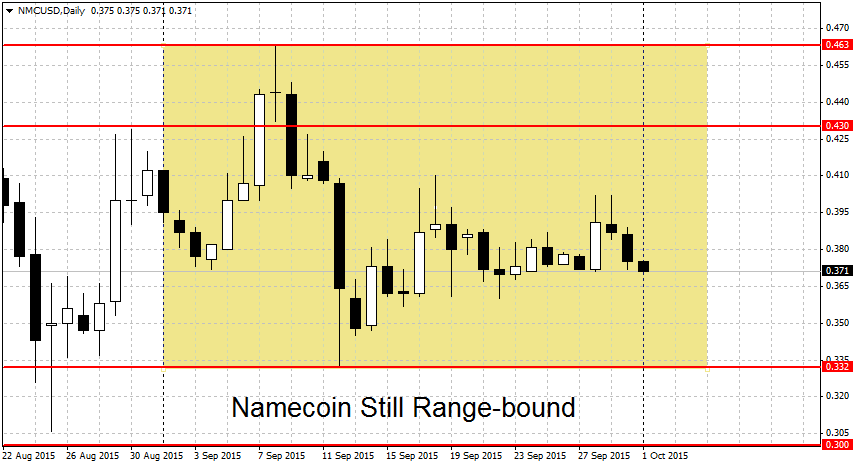
What’s next for Namecoin? The two breakout bounds can be found at $0.27 and $0.463. Notice that the downward breakout point is far from the $0.332 low bound of the range. This is because right below this figure we find several important support levels at $0.30, $0.286 and $0.274. There is very little room for maneuver between any two of these levels. For example, a break below $0.30 would be quickly met with another support at $0.286. Thus a clearing of the 27 cents figure may be needed before a sustainable downtrend can take place.
On the higher end, things are simpler with one important level at the previous swing high of $0.463. A decisive break above this mark could start a new NMC rally. Higher up, the round 50 cents figure marks another important resistance. A breakout above it could lead to more gains.
FXOpen offers the world's most popular cryptocurrency CFDs*, including Bitcoin and Ethereum. Floating spreads, 1:2 leverage — at your service (additional fees may apply). Open your trading account now or learn more about crypto CFD trading with FXOpen.
*Important: At FXOpen UK, Cryptocurrency trading via CFDs is only available to our Professional clients. They are not available for trading by Retail clients. To find out more information about how this may affect you, please get in touch with our team.
This article represents the opinion of the Companies operating under the FXOpen brand only. It is not to be construed as an offer, solicitation, or recommendation with respect to products and services provided by the Companies operating under the FXOpen brand, nor is it to be considered financial advice.
Stay ahead of the market!
Subscribe now to our mailing list and receive the latest market news and insights delivered directly to your inbox.


Latest articles

US Dollar Index: A Defining Week for the King of the Markets
The dollar heads into a pivotal week trading near 101.80, just off a 15-month high, with the Fed's July 29 meeting standing as the clear focal point. Markets currently price roughly a 65% chance of a hold, though renewed

NZD/USD: Inflation Surge Meets Strong US Dollar Pressure
On 21 July, Stats NZ reported an acceleration in inflation: the Consumer Price Index rose 1.5% in the second quarter, while the annual inflation rate climbed to 4.1%, its highest level in more than two years and slightly

Weekly Market Insights with Gary Thomson: The Week of Central Banks and Earnings
In this video, we’ll explore the key economic events and market trends, shaping the financial landscape. Get ready for insights into financial markets to help you navigate the week ahead. Let’s dive in!
In this episode of Market