


FXOpen
During the past two weeks, both Peercoin and Namecoin have paused their rallies. We haven’t reversed course yet as both altcoins are waiting for the next move.
Peercoin Still in Uptrend
Peercoin prices are technically still in an uptrend. But the momentum to the upside is almost completely gone as PPC/USD hasn’t made a new high in almost one month (since January 17th). To renew it, the bulls have to push PPC above this month’s high at $0.305.
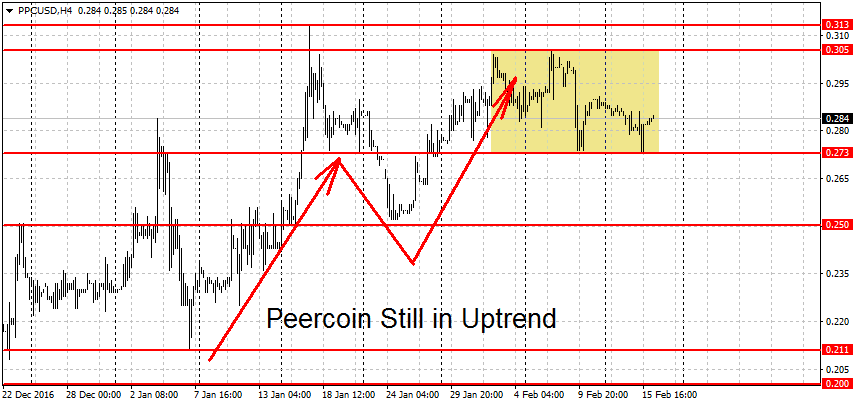
Close-by we find resistance at this year’s high at $0.313. A breakout above here could lead to more gains. Higher up there are more potential levels at 35 cents and the $0.388 swing high. These are followed by the 40 and 50 cents round figures and the $0.524 swing high.
On the other end, a decisive break below the $0.273 swing low would put a definitive end to the current bull run. A move below $0.25 is needed for a new bear market. Below here there’s a cluster of support levels around 20-21 cents. The $0.211 figure is the swing low for January, while $0.206 is last year’s low for PPC/USD. A clearing of this support area with a break below 20 cents should intensify the losses. On the longer-term (weekly and monthly) charts PPC/USD is neutral, neither bullish nor bearish.
Namecoin Waits for Next Move
Similarly to Peercoin, Namecoin traders are waiting for the next move. Here too prices have been flat for the past two weeks. We are currently quoted at $0.239, this compares with a price of $0.244 during our previous update. This is a move of only 2 percent, a very small amount for 14 days of trading in the crypto-world.
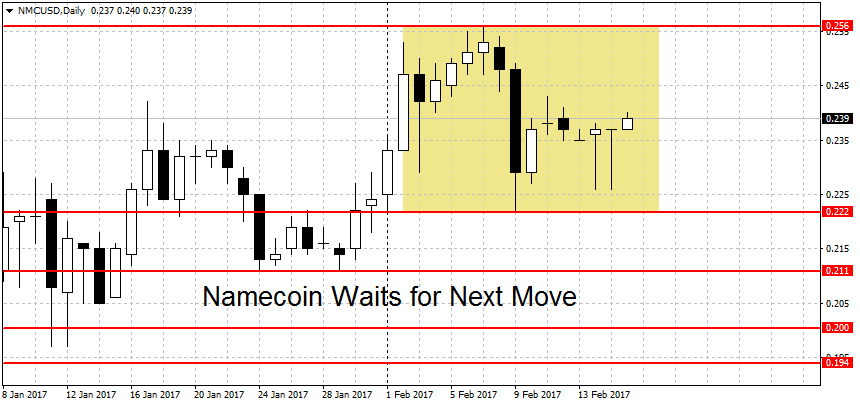
A clean break below the $0.222 swing low is needed to end the uptrend. A new downtrend requires a break below the $0.211 swing as well. We have somewhat weaker support below here at the 20 cents round figure. A stronger support can be found at the $0.194 swing low, followed by last December’s low at $0.162. Further down we have last year’s low at $0.153, a break below here could lead to more NMC losses.
On the upside, the first resistance level is at this month’s high at $0.256 followed by the $0.292 swing high. Then we have the 30 cents round figure and the September resistance at $0.32 dollars. Higher still we find more resistance at the 40 cents round level and the $0.44 swing high. The long-term charts for NMC/USD are still mixed. While the weekly chart is neutral, the monthly is slightly bearish.
FXOpen offers the world's most popular cryptocurrency CFDs*, including Bitcoin and Ethereum. Floating spreads, 1:2 leverage — at your service. Open your trading account now or learn more about crypto CFD trading with FXOpen.
*At FXOpen UK and FXOpen AU, Cryptocurrency CFDs are only available for trading by those clients categorised as Professional clients under FCA Rules and Professional clients under ASIC Rules respectively. They are not available for trading by Retail clients.
This article represents the opinion of the Companies operating under the FXOpen brand only. It is not to be construed as an offer, solicitation, or recommendation with respect to products and services provided by the Companies operating under the FXOpen brand, nor is it to be considered financial advice.
Stay ahead of the market!
Subscribe now to our mailing list and receive the latest market news and insights delivered directly to your inbox.

Latest articles

Weekly Market Wrap With Gary Thomson: Nasdaq, EUR/USD, USD/CHF, Brent Crude Oil, Googl Shares
Get the latest scoop on the week's hottest headlines, all in one convenient video. Join Gary Thomson, the COO of FXOpen UK, as he breaks down the most significant news reports and shares his expert insights.
- Nasdaq Composite: Worst Session

Analysis of AUD/USD: Exchange Rate Falls to Early May Low
As indicated by the 4-hour AUD/USD chart today:
→ the rate fell below 0.652, a level last seen on May 2;
→ the RSI indicator dropped below 15, a level last seen during the panic over the spread of COVID-19

Analysis of AMZN Stock: Price at 1.5-Month Low
As shown in the AMZN chart, the stock price dropped below:
→ the psychological level of $180;
→ the mid-June interim low.
The last time AMZN traded below $180 was in early June.
Thus, AMZN has faced sell-offs, similar to other tech