


FXOpen
A pin bar candle is one of those patterns traders talk about a lot, but often without much precision. Used properly, it can offer clues about rejected price levels and shifting control between buyers and sellers. This article breaks down what a pin bar candle actually represents, how traders identify pin bars, and how traders can develop a pin bar trading strategy.
Key Takeaways
- A pin bar candle is a reversal pattern defined by a small real body and a long upper/lower wick showing strong price rejection.
- Pin bars carry more weight when they form at clear support, resistance, or failed breakout levels.
- Higher timeframes tend to produce more useful pin bar signals than lower ones.
- The length and placement of the wick matter more than the candle colour.
What Is a Pin Bar Candle?
A pin bar is a reversal candlestick pattern that stands out on a chart due to its unique shape: a small real body with a long upper/lower wick.
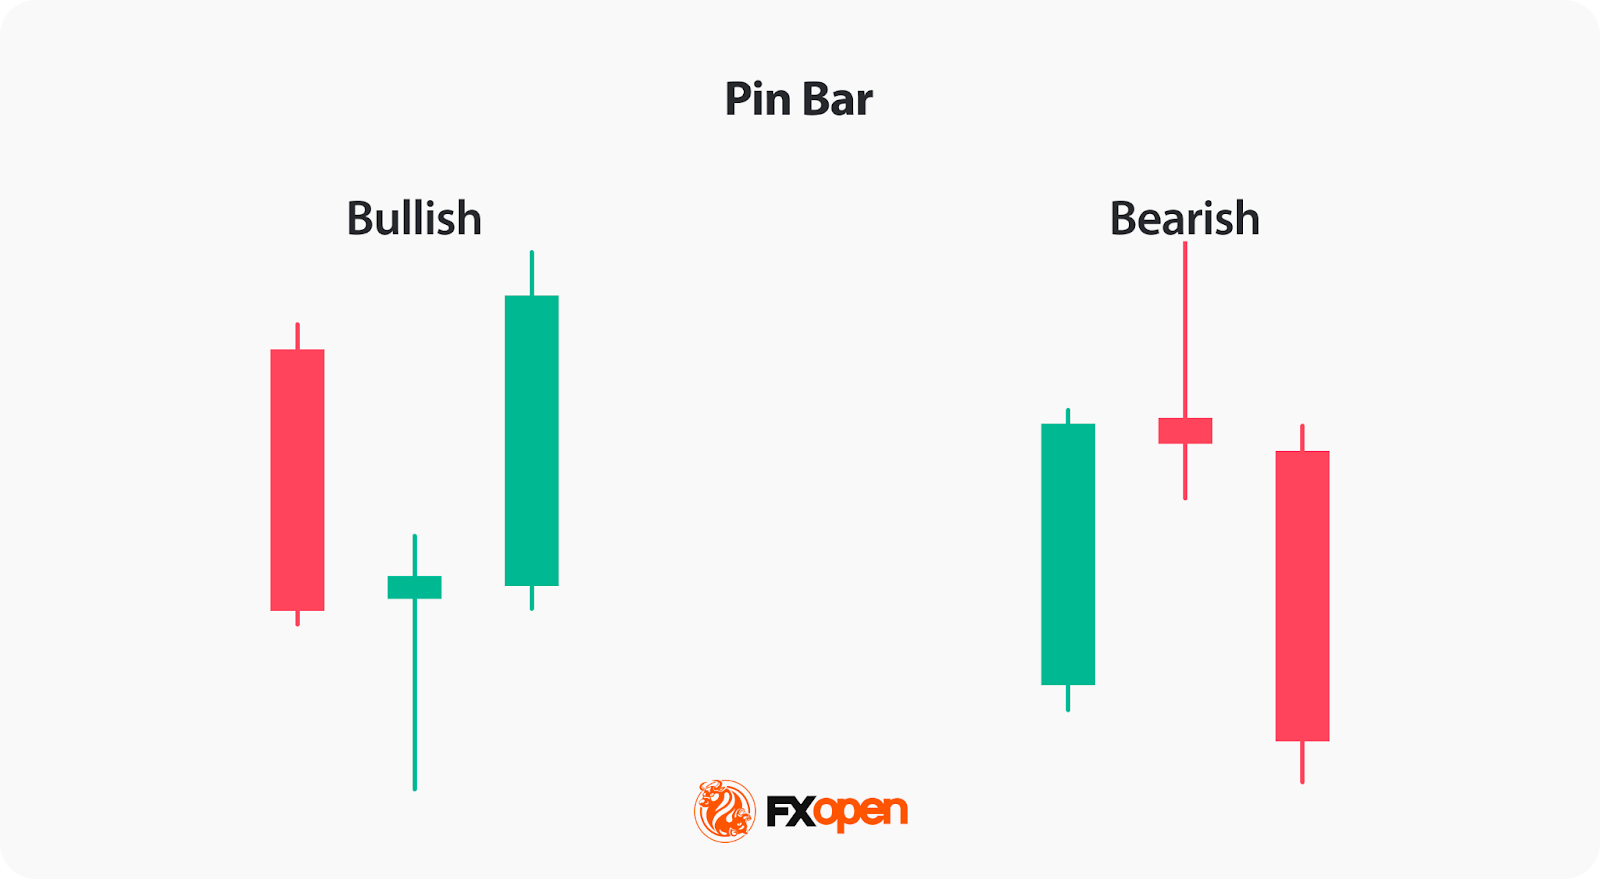
There are two main types of pin bar candlestick: bullish and bearish:
- A bullish pin bar has a long lower wick and a small body at the top. It appears at the end of a solid downward movement and usually indicates that buyers are entering the market. This pattern signals a potential upward reversal.
- A bearish pin bar has a long upper wick and a small body at the bottom. It appears after a strong upward movement, suggesting that sellers are gaining strength, which can precede a downward price reversal.
When a pin bar appears on a chart, it reflects a tug-of-war between buyers and sellers that resulted in a significant price rejection. This rejection is captured by a key element, the long wick. According to Steve Nison's Japanese Candlestick Charting Techniques, this long wick is considered a failed price acceptance and instead marks rejection from a price level and a possible turning point.
While the pattern is believed to be reliable at support or resistance levels, it is considered especially important when it forms after a push beyond a key swing high or low. The appearance of a pin bar in these scenarios might indicate a failed breakout, where the market rejected a close above a significant high or low, and may lead to a strong reversal.
How May Traders Identify a Pin Bar Candlestick on a Price Chart?
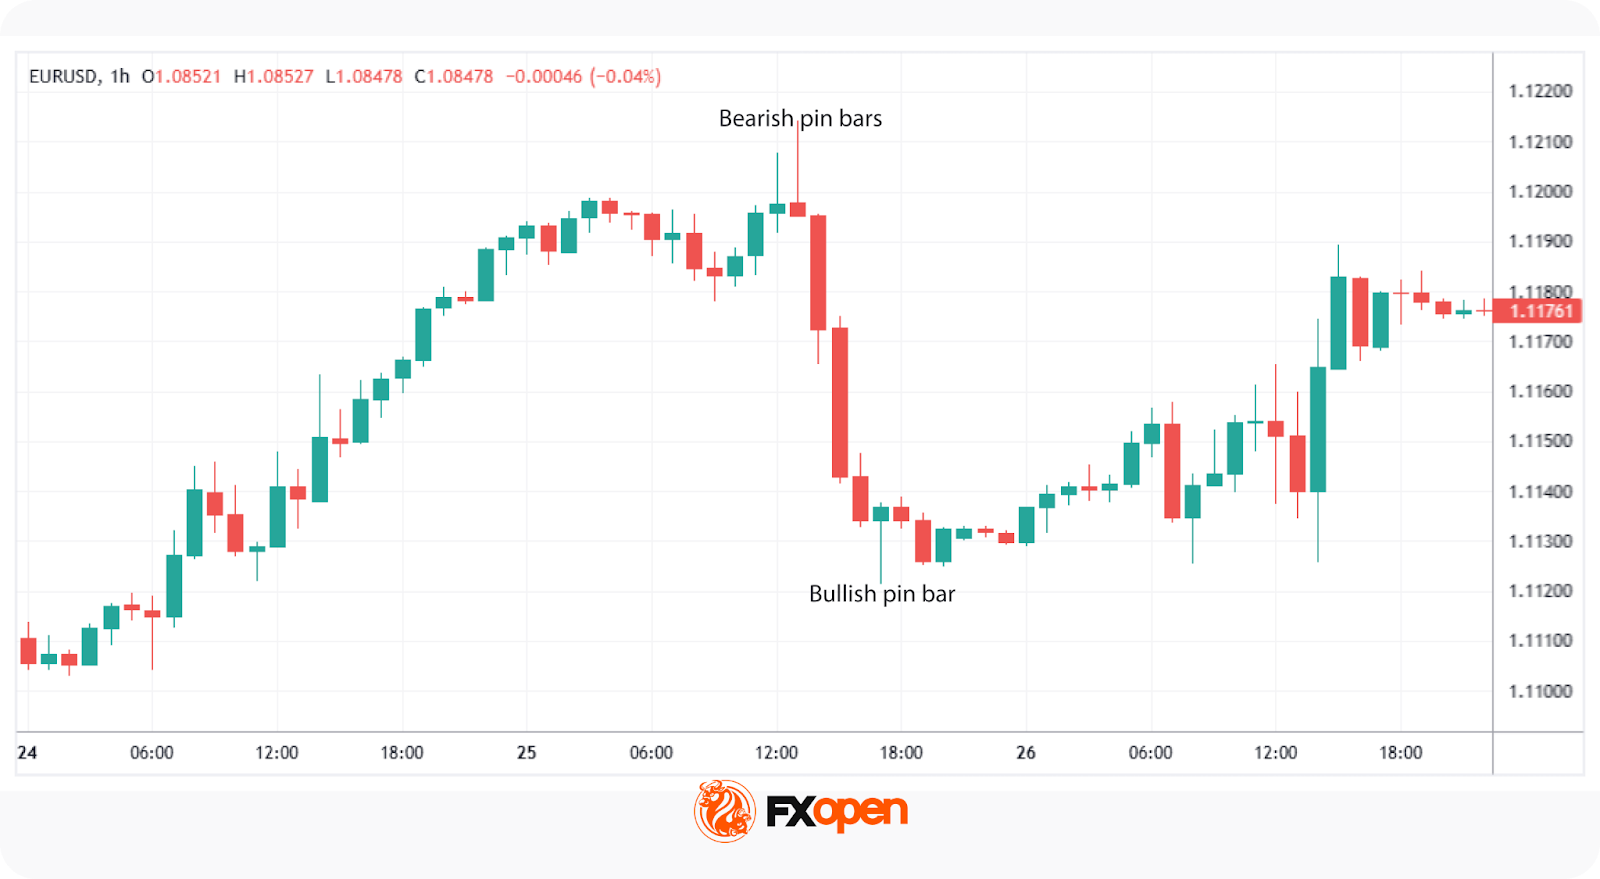
To spot a pin bar pattern, traders often look for:
- Long Wick: The wick should make up at least two-thirds of the candle's total length, or even more. This long wick represents a sharp rejection of a price level during the trading period.
- Small Real Body: The real body should be relatively small compared to the wick. This indicates that the price closed near where it opened, despite significant movement during the session. While it’s preferable for the candle to close green in a bullish pin bar and red in a bearish pin bar, it’s not necessary.
- Wick Position: For a bullish pin bar, the long wick extends below the body, suggesting that sellers pushed the price down before buyers drove it back up. In a bearish pin bar candlestick pattern, the long wick is above the body, indicating that buyers pushed the price up before sellers brought it back down.
- Contextual Placement: Pin bars are believed to be most significant when they appear at key support or resistance levels or within established trends. Their location may contribute to their potential relevance in market analysis.
If you’d like to try and identify the pattern for yourself, you can consider heading over to FXOpen’s TickTrader platform to explore real-time charts and trade in over 700 instruments.
Main Points of Pin Bar Pattern Trading
Trading pin bars goes beyond simply recognising the pattern; it involves understanding how they fit into the broader market context. Here are some practical steps you may apply to a pin bar candlestick pattern strategy:
Selecting High-Quality Pin Bars
Not all patterns carry the same weight. According to the theory, traders should focus on those with a long wick that constitutes at least two-thirds of the candle's total length and a small real body. The longer the wick relative to recent candles, the more significant the price rejection might be.
Also, the overall size of the candle may boost its reliability. A pin bar that stands out compared to surrounding candles may indicate a significant shift in market sentiment. If it's too small relative to recent candles, it might be less reliable.
Considering the Timeframe
The timeframe you choose can impact the reliability of the formation. Higher timeframes like daily or weekly charts tend to produce more dependable signals because they encapsulate more data and reflect broader market sentiment.
While lower timeframes like 15-minute or hourly charts may offer more trades, they may also present more false signals. However, a pin bar on a higher timeframe can offer valuable insights into what may drive lower timeframe price movements.
Being Mindful of Market Conditions
Pin bars can be less reliable in choppy or sideways markets where price action lacks clear direction. In such environments, they may form frequently but without leading to significant price movements. According to the theory, traders should apply pin bar strategies in markets that exhibit clear trends or strong momentum, where price rejections are more meaningful.
Likewise, high volatility can lead to erratic market movements, increasing the likelihood of false signals. Paying attention to economic calendars and avoiding trading during major news releases may help in filtering out unreliable setups.
Focusing on Key Psychological Levels
Beyond support and resistance, pin bars may be significant when they form at key psychological price levels, such as round numbers or significant historical price points. These levels often act as barriers where market participants have strong reactions; academic research in the Journal of International Financial Markets, Institutions and Money specifically highlights how round numbers attract attention and orders—the kind of conditions that may make a pin bar more significant. A pin bar at a psychological level can indicate a substantial price rejection, providing a potentially valuable signal for a trade setup.
Pin Bar Strategy
Pin bars can be a valuable component of a trader's analytical toolkit when used thoughtfully. Here are the specific steps traders might follow to use a pin bar strategy:
Identifying Potential Pin Bars
The first step is to scan the charts for candles that exhibit the classic shape—a small real body with a long wick that makes up at least two-thirds of the candle's total length.
Examining the Context
Once a potential pattern is identified, traders assess its placement on the chart. A CFA Institute Research Foundation review describes support and resistance as price areas where buying or selling pressure is expected to develop strongly enough to reverse a trend, which is exactly the kind of context that makes a pin bar more meaningful than the candle shape on its own.
However, trendlines, Fibonacci retracements, and even whether price breaches and closes back inside of these key levels can also provide key confluence. Ultimately, they’re only considered reliable when they occur in the opposite direction of a specific trend, such as a bearish pin bar candle during an established uptrend.
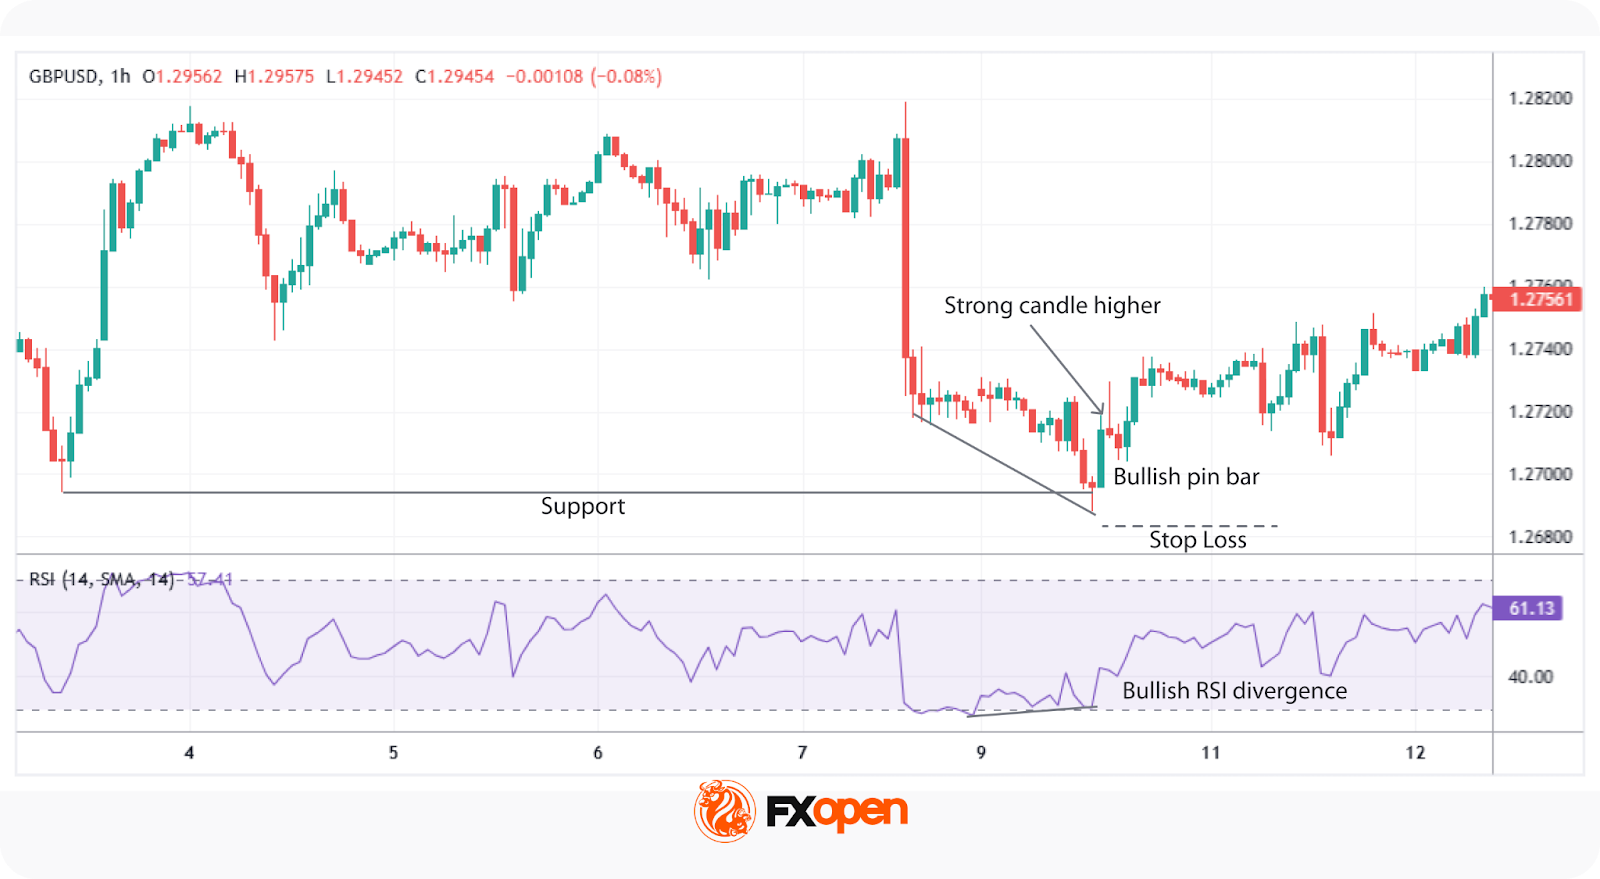
Looking for Confirmation
Traders often seek additional signals to validate the implications of a pin bar candle pattern. For instance, if the Relative Strength Index or Stochastic Oscillator indicates a market is overbought or shows a divergence, a bearish pin bar may be considered a stronger signal. Confirmation may boost confidence in the signals provided by the pattern.
Planning Entry and Exit Strategies with Pin Bars
These are the common entry and exit points of the pin bar strategy.
- Entry point: Some traders may enter as soon as the candle closes if they trade on small timeframes. However, more conservative traders consider entering a trade if the price moves beyond the bar in the anticipated direction, potentially with another big bar candle like an engulfing candle or marubozu. A large move may confirm a reversal pattern.
- Stop loss: Stop-loss orders are often placed beyond the candle’s high or low considering the 1:3 or 1:2 risk-reward ratio in case the market moves unfavourably.
- Take profit: Profit targets might be set at an opposing support or resistance level or a given risk-reward ratio of 1:3 or 1:2.
Risks and Limitations of the Pin Bar Candle Pattern
While pin bars can offer valuable insights, they also come with certain risks and limitations that traders should be aware of:
- False Signals: Pin bars can sometimes indicate a potential reversal that doesn't materialise. Relying solely on them without considering the broader market context might lead to misinterpretation and wrong trading decisions.
- Market Noise: In highly volatile or sideways markets, pin bars may appear frequently but lack significance. These "noisy" signals can make it challenging to distinguish meaningful patterns from random price movements.
- Timeframe Variability: The reliability of the pattern can vary across different timeframes. A pin bar on a 5-minute chart might not hold the same weight as one on a daily chart. Traders consider the timeframe that aligns with their trading strategy and be cautious when interpreting signals from shorter periods.
- Subjectivity in Identification: Determining what qualifies as a valid formation can be subjective. Differences in candles across various charting platforms or discrepancies in data can lead to inconsistent analysis.
Comparing Pin Bars with Other Patterns
Understanding how pin bars differ from other candlestick patterns can support your technical analysis. Let's explore how they compare to hammers, shooting stars, and doji candles.
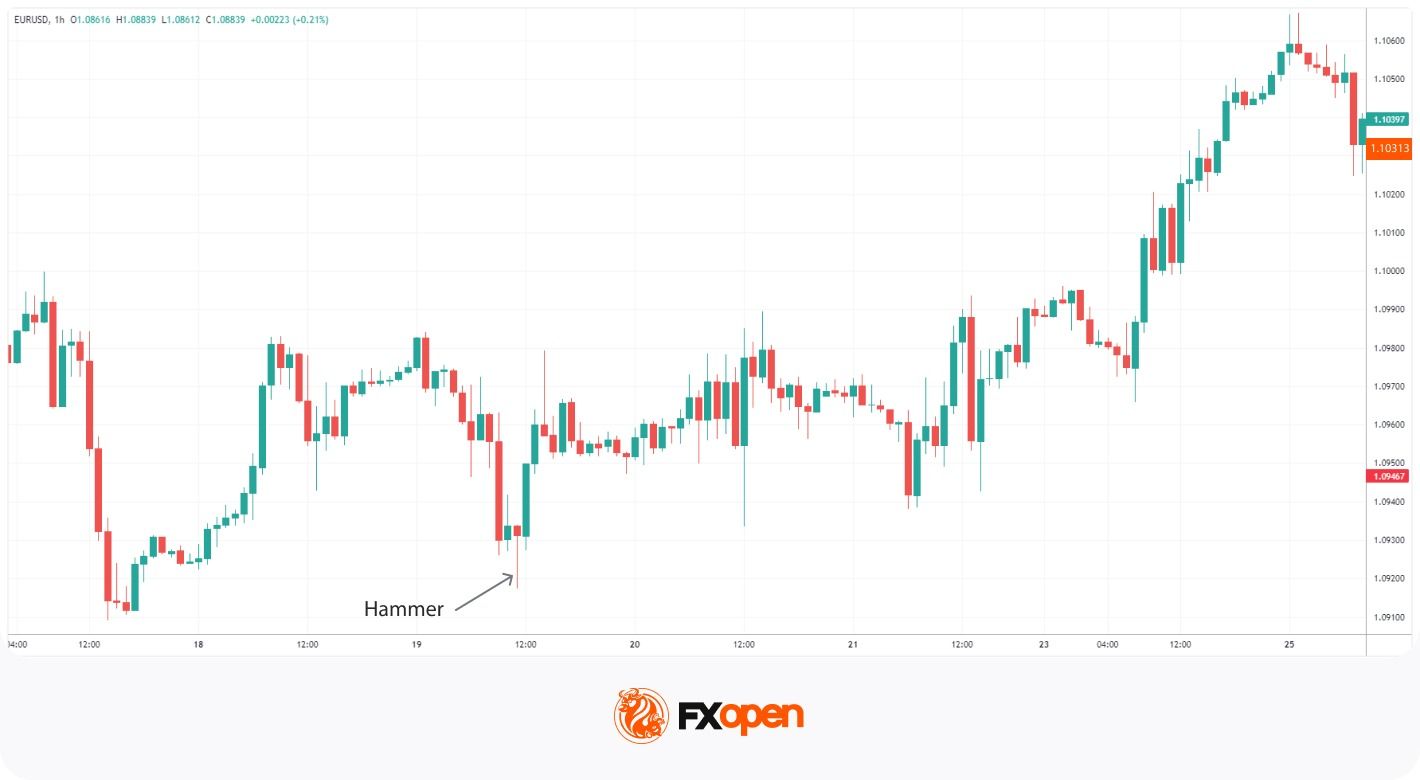
Pin Bar and Hammer/Inverted Hammer
Hammers are essentially the same as bullish pin bars; they just have a different name. Both patterns feature a small real body with a long lower wick and little to no upper wick, appearing after a downtrend and signalling an upward reversal.
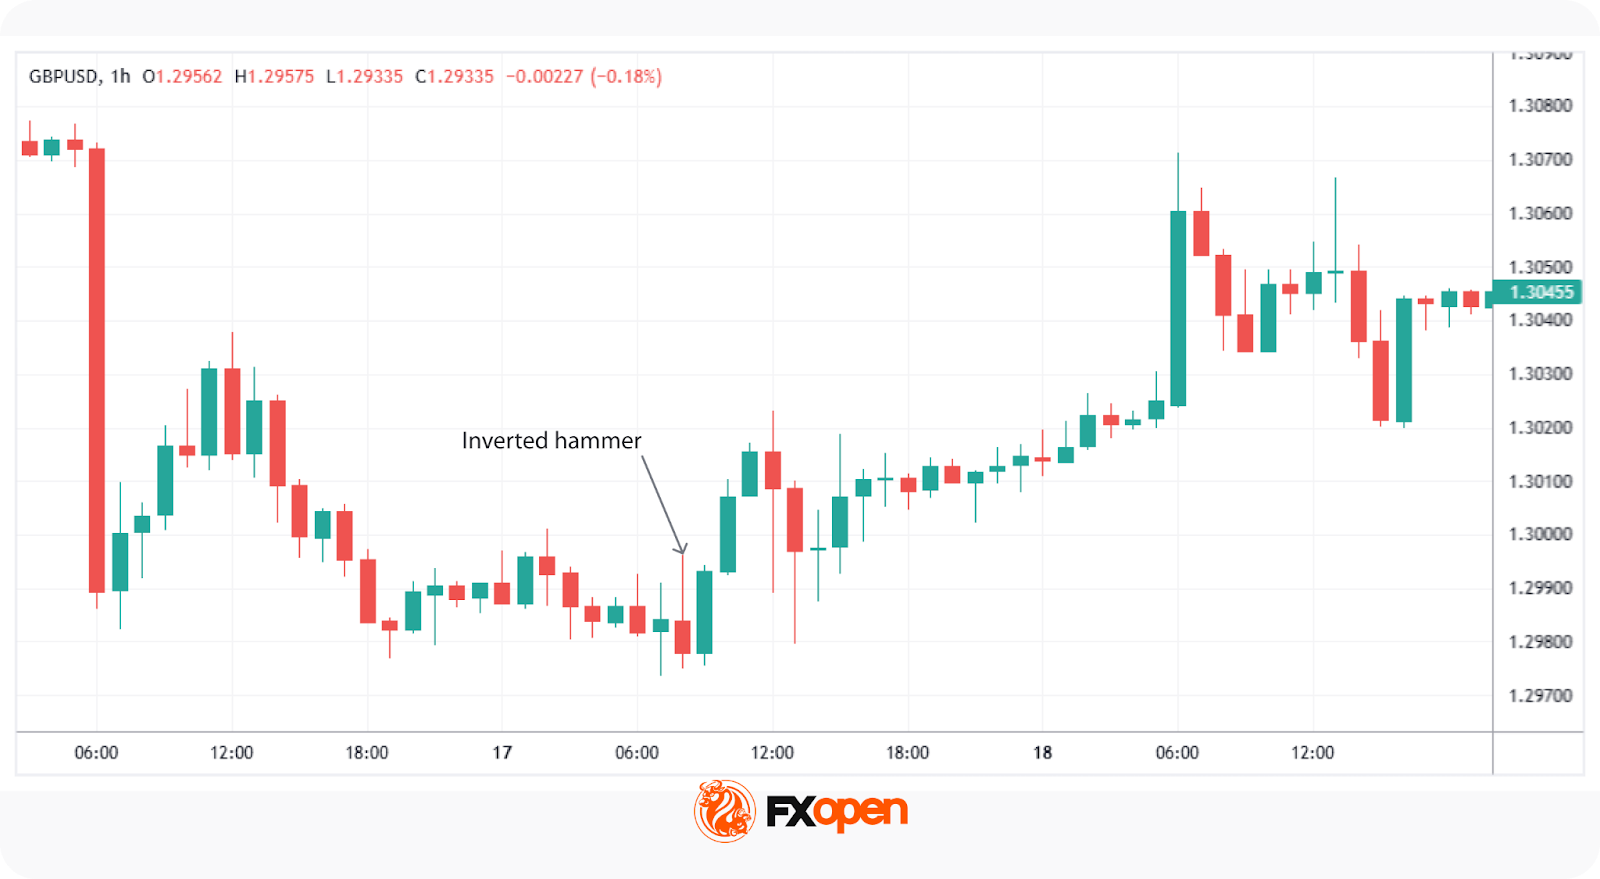
The inverted hammer differs from a pin bar in its context and implications. An inverted hammer has a tiny real body, a long upper wick, and little to no lower wick. It typically appears after a downtrend. While it resembles a bearish or red pin bar candle in shape, its position at the bottom of a downtrend signals that buyers attempted to push the price higher but couldn’t. Still, this pattern indicates a possible upward reversal due to emerging buying interest.
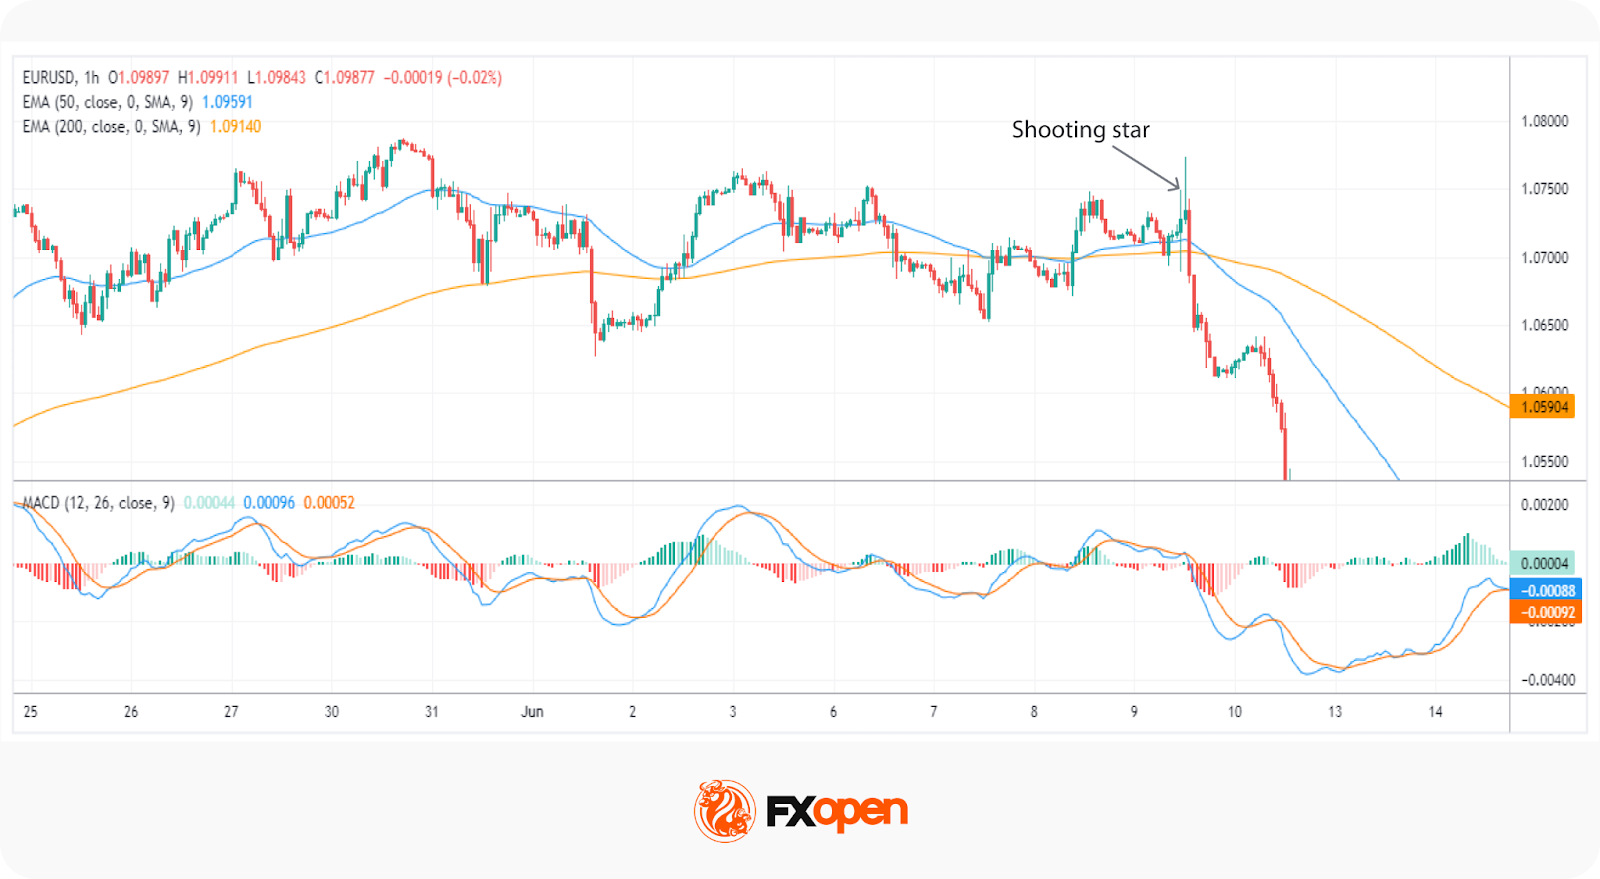
Pin Bar and Shooting Star
A shooting star is essentially a bearish pin bar. It appears after an uptrend and retains the same features: a small real body, a long upper wick, and a minimal lower wick. The long upper wick reflects the rejection of higher prices, potentially signalling a downward reversal.
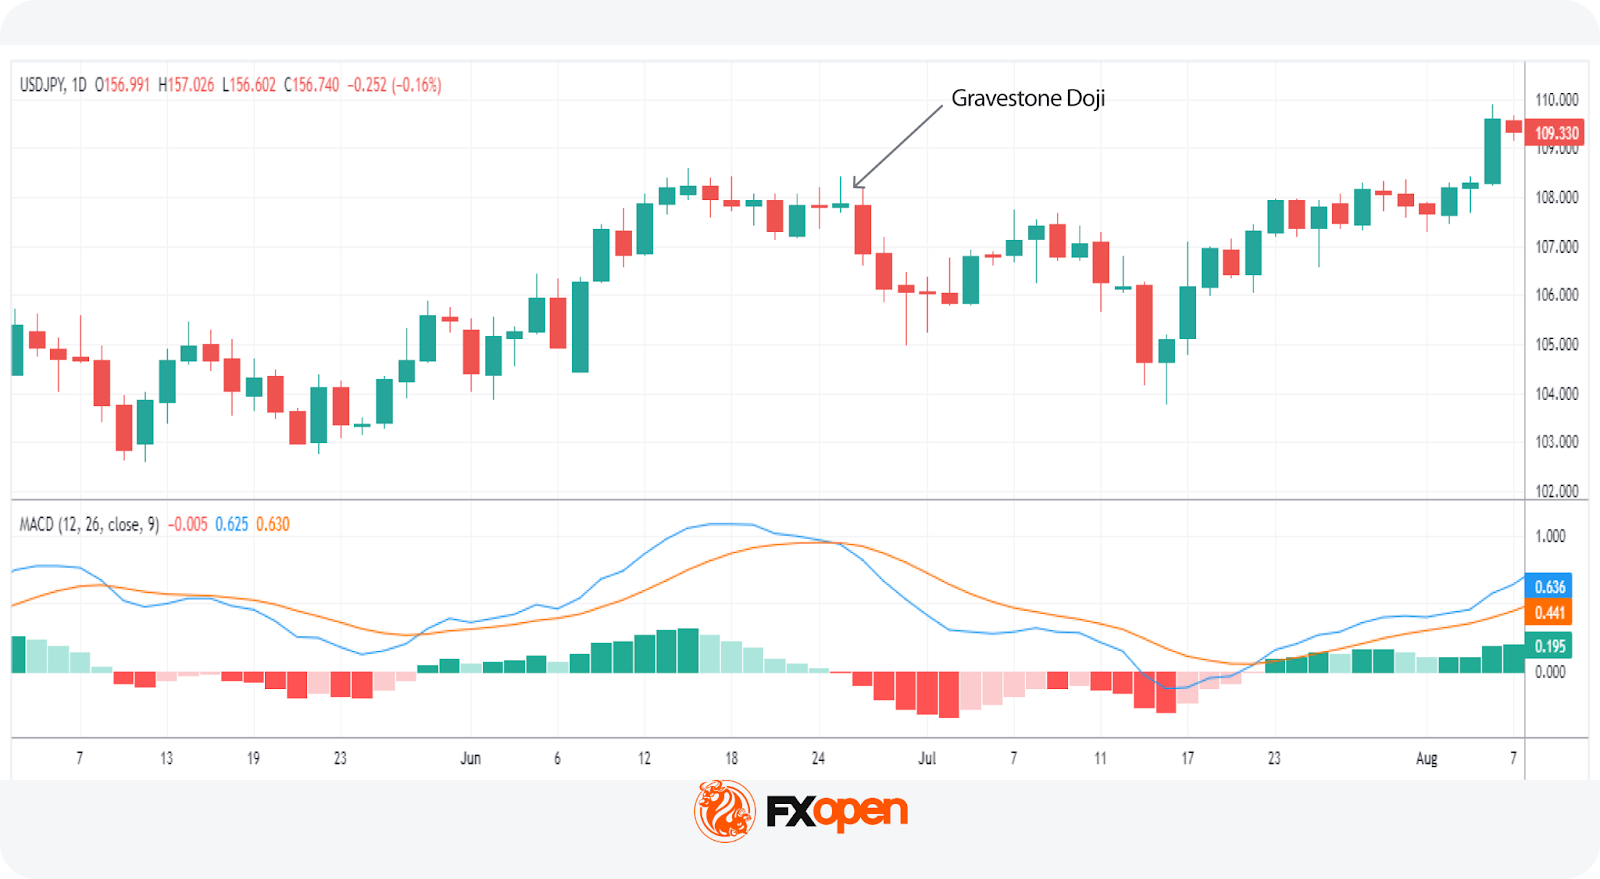
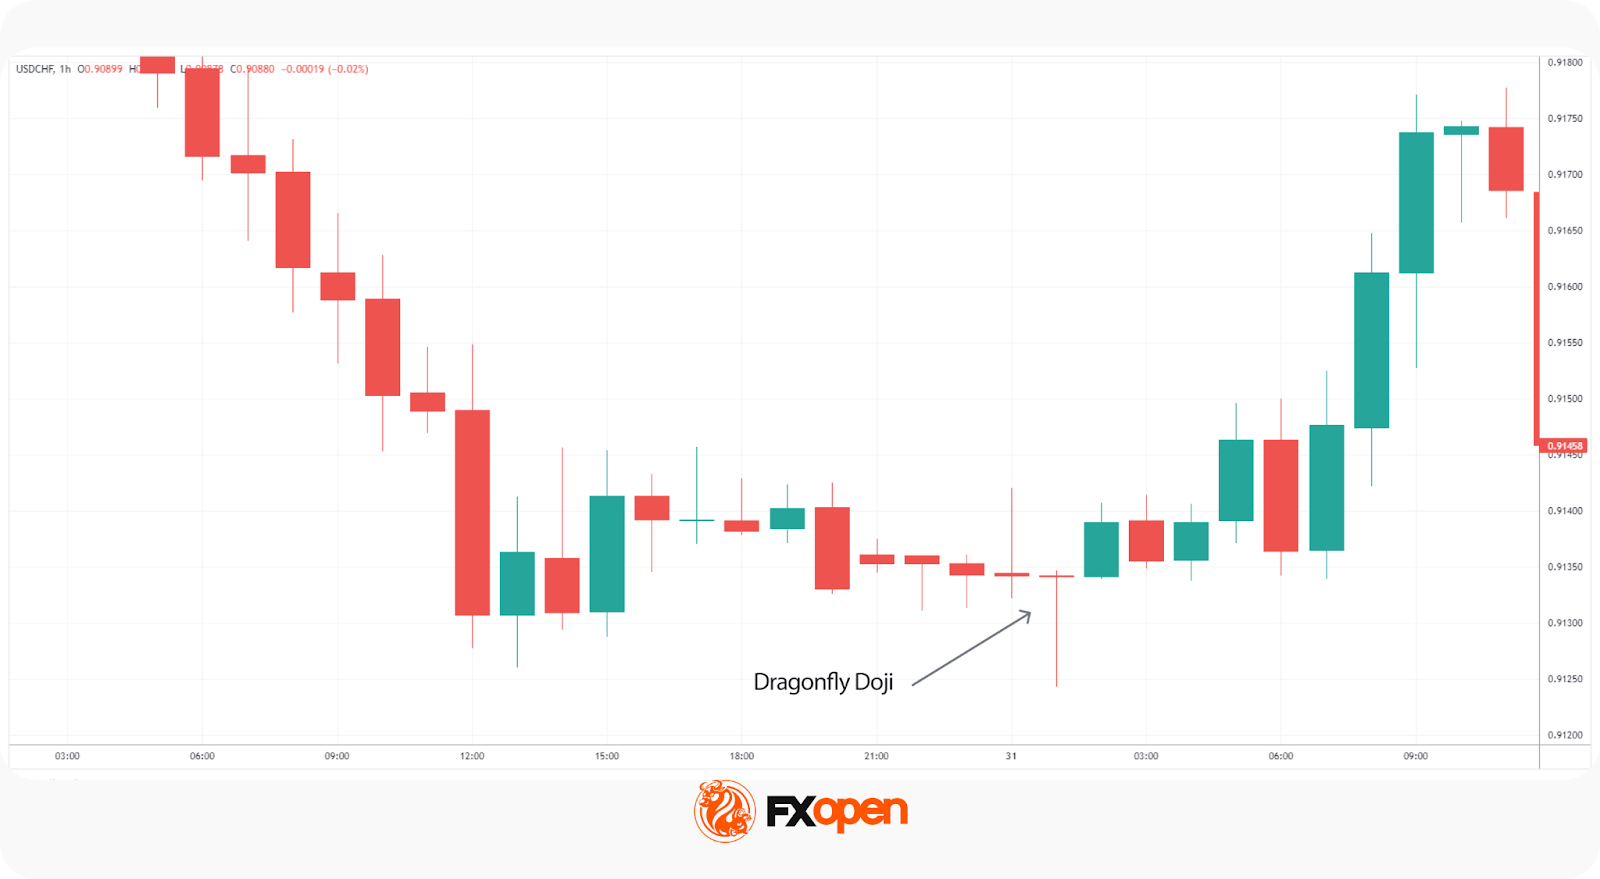
Pin Bar and Gravestone and Dragonfly Dojis
The pin bar, gravestone doji, and dragonfly doji are all candlestick patterns used to indicate potential reversals, but they differ in structure and context. The gravestone doji has a long upper wick and no lower shadow, with the open, high, and close at nearly the same level. This formation suggests that buyers pushed prices higher, but sellers ultimately took control, often indicating a bearish reversal at the top of an uptrend.
The dragonfly doji, on the other hand, has a long lower wick and no upper shadow, with the open, low, and close prices near each other. This pattern suggests that sellers initially drove prices down, but buyers regained control, often signalling a bullish reversal when found at the bottom of a downtrend.
The Bottom Line
Pin bar candles offer traders valuable insights into market sentiment. While incorporating pin bars into your strategy requires practice and careful attention to market conditions, they can serve as a supplementary signal when trading market reversals. Used consistently, they may help traders focus on areas where price has clearly been rejected rather than guessing turning points. When combined with structure, trend direction, and risk management, pin bars can form part of a disciplined, repeatable decision-making process.
If you're ready to apply these insights in live markets, you can consider opening an FXOpen account to access more than 700 instruments alongside tight spreads and low commissions (additional fees may apply).
FAQ
What Is the Pin Bar Candlestick Pattern?
A pin bar candlestick pattern signals a potential price reversal and features a small body with a long wick which is at least twice longer than the body. The long wick represents price rejection at a specific level, indicating a shift in market sentiment during that trading period. The pattern has two types: bearish and bullish.
What Is the Difference Between a Bullish and Bearish Pin Bar?
A bullish pin bar pattern has a long lower wick, suggesting buyers regained control and a possible upward reversal. A bearish variation features a long upper wick, indicating sellers dominate and a potential downward movement.
How Can You Trade Pin Bars?
To trade pin bars, traders identify them at key support or resistance levels, where they signal a potential reversal. For a bullish pin bar at support, they might consider entering a long position above the high of the bar, with a stop loss below the low. For a bearish pin bar at resistance, they might enter a short position below the low, placing a stop loss above the high. Confirmation from other technical indicators or trends may support the signals of the setup.
What Is the Difference Between a Hammer and a Pin Bar Candle?
A hammer is a bullish pin bar candle with a long lower wick, appearing after a downtrend to signal a potential upward reversal. While a pin bar can be bullish or bearish, a hammer specifically refers to the bullish variant.
This article represents the opinion of the Companies operating under the FXOpen brand only. It is not to be construed as an offer, solicitation, or recommendation with respect to products and services provided by the Companies operating under the FXOpen brand, nor is it to be considered financial advice.
Stay ahead of the market!
Subscribe now to our mailing list and receive the latest market news and insights delivered directly to your inbox.


Latest articles


Market Insights with Gary Thomson: Oil, US Retail Sales & NFP in Focus
In this video, we’ll explore the key economic events and market trends, shaping the financial landscape. Get ready for insights into financial markets to help you navigate the week ahead. Let’s dive in!
In this episode of Market

Geopolitics Fuels Volatility: AUD/USD and USD/CAD Near Key Levels
Commodity-linked currencies continue to weaken amid rising geopolitical tensions, which are boosting demand for safe-haven assets and increasing volatility across both FX and commodity markets. The US dollar is gaining support from demand for liquid and defensive assets, while currencies