FXOpen

Technical analysts and price action traders use chart patterns in addition to technical indicators to identify potential trading opportunities. The rounding top chart pattern helps spot a trend reversal and is in the arsenal of many. Our guide will discuss all the technicalities of the rounding top pattern, how to trade it, and the associated risk management strategies.
What Is the Rounding Top Pattern?
A rounding top pattern is a price action formation that resembles an inverted "U" shape and signals a potential reversal in a bullish trend. The pattern is hard to find and can require extensive chart knowledge for proper identification. Traders may need to employ other indicators and solid risk management strategies to trade it profitably. On the TickTrader platform, you can test various indicators and patterns for free.
The rounding top pattern can be found in different timeframes of various assets. At FXOpen, you can trade the rounded top pattern on various financial markets, such as forex, stock, ETF, index, cryptocurrency*, and commodity.
How Can You Identify a Rounding Top Pattern?
The rounding top pattern emerges when prices hit a high point in an uptrend and then begin to rebound, creating a gradual curve that becomes more pronounced as the downward momentum gains strength. This pattern is typically confirmed when the security breaks through its support level, known as the neckline.
The neckline goes through the low points where the market has previously struggled to break through. By drawing a horizontal line at this level, traders can better visualise the potential price movement and anticipate possible market reversals.

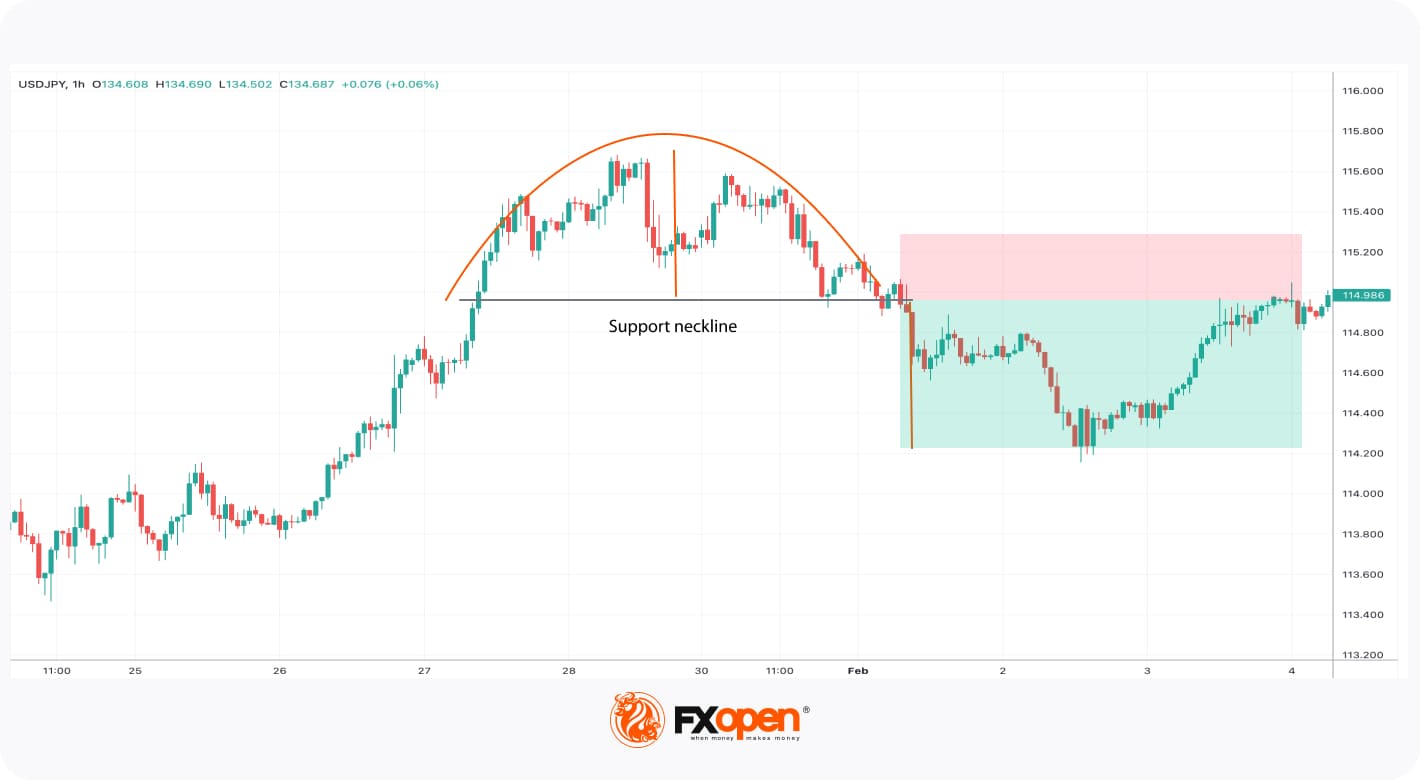
A rounding top formation on the H1 chart of USDJPY. Traders typically categorise this into three primary segments – an upward movement, a period of stability or consolidation, and a downward push as sellers take control.
The Rounding Bottom Pattern
The rounding bottom pattern is the opposite of a rounded top, appearing during a downtrend. It indicates a forthcoming change from a down to an uptrend.

The image above displays a rounding bottom pattern on the 30-minute chart of EURUSD. This pattern appears as a "U" shape and is formed when the price hits a low point, consolidates, and then gradually rebounds. Instead of support, traders will observe a resistance, which can be drawn by connecting two or more of the highest points of the rounding bottom with a horizontal line.
Rounding Top vs Inverted Cup and Handle Pattern
The rounding top and inverted cup and handle formations may appear similar at first glance, but they have distinct differences that traders should understand to avoid confusion. The rounding top is a bearish reversal pattern, while the inverted cup and handle is typically a bearish continuation formation. The presence of a handle in the inverted cup and handle pattern is a key distinguishing factor.

The H4 chart of AMZN shows an inverted cup and handle pattern. Unlike the rounding top, there is a handle, a short-term movement of the price in the opposite direction to the overall trend.
The patterns have different trading rules. Therefore, it’s vital to distinguish between them. Before entering the live market, you can examine the patterns using the FXOpen TickTrader platform.
Trading with the Rounding Top Pattern
Trading rules for the rounding top pattern are simple. Once it is identified, traders usually wait for the price to close below the neckline before entering a short position. The placement of the stop-loss order can be determined by a risk-reward ratio and current market conditions, but it’s always placed above the neckline as the price can test the level after the breakout. For a take-profit level, traders measure the distance between the peak and the neckline and use that same value from the neckline downwards.

In the example above, we can simulate the scenario of trading rounding top. As the price breaks the support, the trader places a short position with the stop-loss level above the neckline. The take profit target is equivalent to the distance from the trough to the neckline.
How Can You Confirm the Pattern?
Patterns are not relied upon on their own by traders due to the likelihood of their failure. To confirm the sell signal, traders may look for a surge in trading volume during a breakout below the neckline.

The chart shows a rounded top pattern. The breakout occurs with a significant sell volume. This provides us with more confluences on the short.
Special Consideration

In the chart above, the rounding top reversal pattern is visible as the market reverses from an up to a downtrend continuing in the bearish direction. However, standard trading rules could fail because the price rose significantly above the neckline. Only an effective risk-reward ratio would help a trader to avoid an early exit.
Final Thoughts
It is important to remember that chart patterns are not a guarantee and should be used in conjunction with other technical indicators and risk management strategies. Traders should also be aware of the potential for false signals and be ready to adjust their trading strategies accordingly. Overall, the rounding top is a valuable addition to any trader's toolkit and can help increase their chances of success in the markets. Market participants can open an FXOpen account and start trading using their technical tools right away.
*At FXOpen UK and FXOpen AU, Cryptocurrency CFDs are only available for trading by those clients categorised as Professional clients under FCA Rules and Professional clients under ASIC Rules, respectively. They are not available for trading by Retail clients.
This article represents the opinion of the Companies operating under the FXOpen brand only. It is not to be construed as an offer, solicitation, or recommendation with respect to products and services provided by the Companies operating under the FXOpen brand, nor is it to be considered financial advice.
This article represents the opinion of the Companies operating under the FXOpen brand only. It is not to be construed as an offer, solicitation, or recommendation with respect to products and services provided by the Companies operating under the FXOpen brand, nor is it to be considered financial advice.
Stay ahead of the market!
Subscribe now to our mailing list and receive the latest market news and insights delivered directly to your inbox.


