


FXOpen
Today the U.S. Securities and Exchange Commission rejected the Winklevoss ETF again. Last year in March the SEC already rejected this ETF after delaying the decision as long as it could. But in June the twins submitted a proposed rule change to the ETF, which is now also rejected. Due to the importance of this decision we will change our usual format for Thursday from covering ETH and Dash to BTC and ETH. Don’t worry though, we’ll come back to Dash next week!
Bitcoin Drops on ETF Rejection
Bitcoin prices dropped over 5 percent on the news. The reasons for the rejection echo earlier sentiment by regulators about ‘fraud and manipulation of bitcoin, particularly since this is done in a largely unregulated offshore market.’ The agency added that more than three-fourths of the volume in bitcoin occurs outside the United States, and that 95 percent of the volume occurred on non-U.S. exchanges.
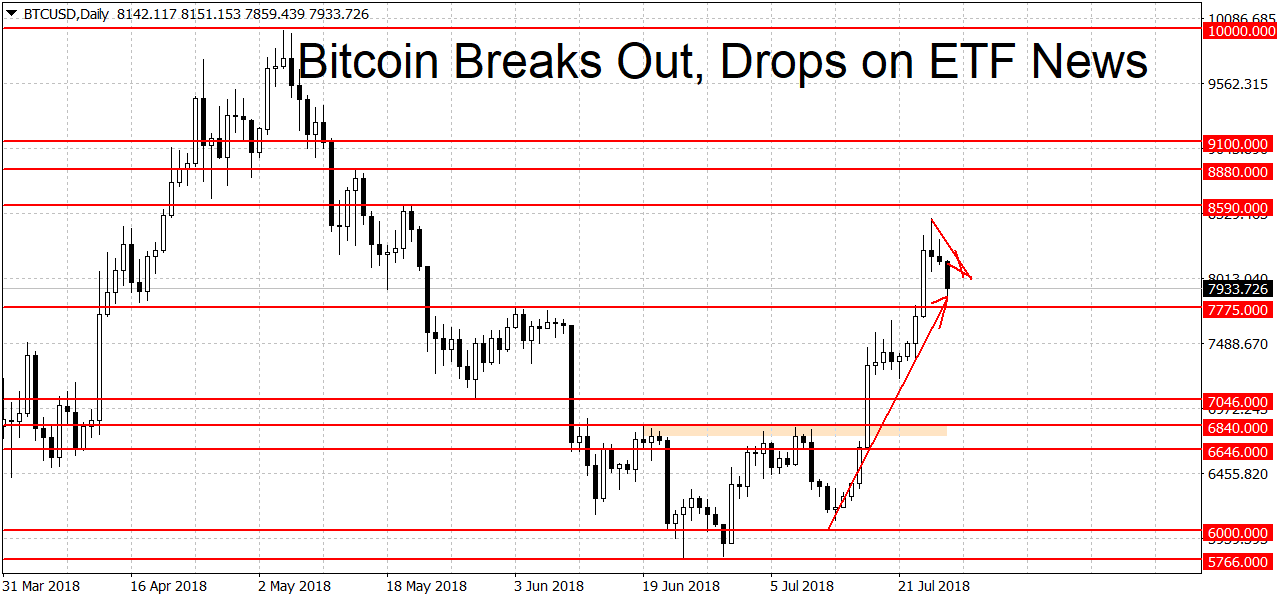
On the technical side we are still in a bullish trend with the breakout above $6,840. Today’s news should worry the bulls as the rally was underpinned by speculation about possible ETF approval in August. With today’s decision and the reasons for the rejection being centered on the bitcoin markets as a whole and not this particular application, that ETF seems dead in the water as well.
However the bears will need a break below $6,646 dollars to end the current uptrend. A move below the $6,000 mark is needed to start a downtrend in prices. On the picture above you can see more potential support and resistance levels. On the weekly chart bitcoin is bearish. The monthly charts is holding onto the bullish bias.
Ether Still in Downtrend
Ether was positively affected by today’s SEC decision, at least versus bitcoin. While ETH/USD is down around 3%, ETH/BTC is up by around 1 percent since the news came out. Ether along with many alts was sold in the days prior as speculation heated up about a possible approval of a bitcoin ETF.
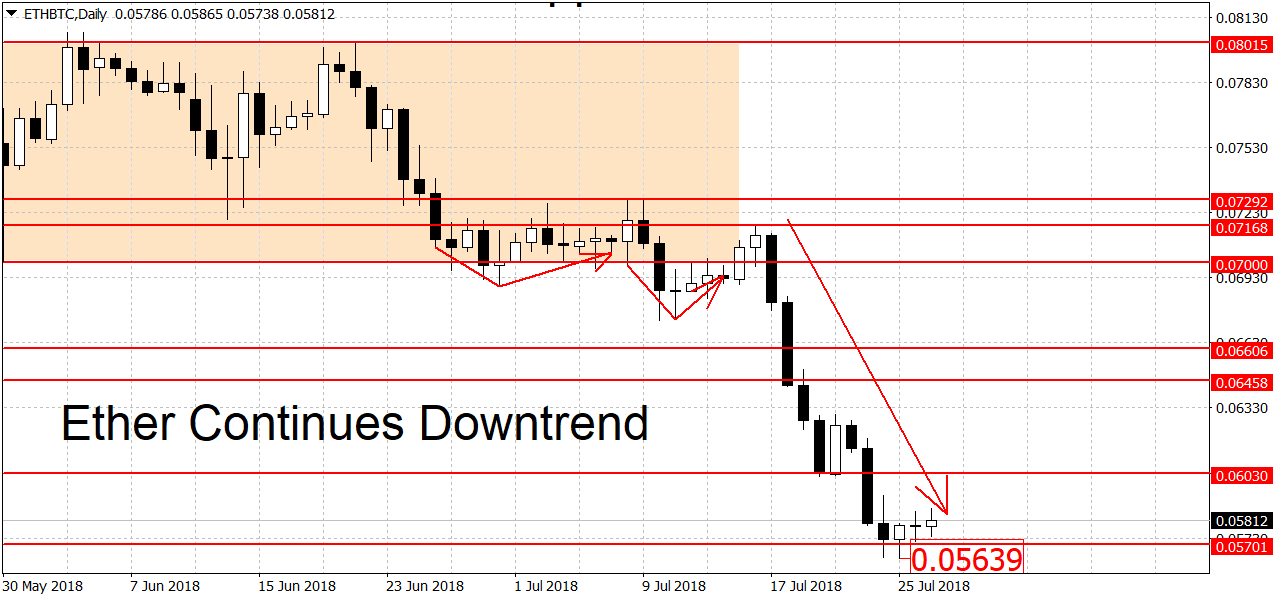
Still, ETH/BTC remains in a downtrend on the daily charts, as you can probably notice from the pic above. A breakout above 0.07168 BTC is needed to end the bear market while a breakout above the 0.07292 BTC swing high would start a new rally. On the longer-term charts there’s no change, Ether is range-bound on the weeklies but bullish on the monthlies.
Trade Bitcoin on FXOpen Crypto accounts
FXOpen offers the world's most popular cryptocurrency CFDs*, including Bitcoin and Ethereum. Floating spreads, 1:2 leverage — at your service. Open your trading account now or learn more about crypto CFD trading with FXOpen.
*At FXOpen UK and FXOpen AU, Cryptocurrency CFDs are only available for trading by those clients categorised as Professional clients under FCA Rules and Professional clients under ASIC Rules respectively. They are not available for trading by Retail clients.
This article represents the opinion of the Companies operating under the FXOpen brand only. It is not to be construed as an offer, solicitation, or recommendation with respect to products and services provided by the Companies operating under the FXOpen brand, nor is it to be considered financial advice.
Stay ahead of the market!
Subscribe now to our mailing list and receive the latest market news and insights delivered directly to your inbox.

Latest articles

Weekly Market Wrap With Gary Thomson: Nasdaq, EUR/USD, USD/CHF, Brent Crude Oil, Googl Shares
Get the latest scoop on the week's hottest headlines, all in one convenient video. Join Gary Thomson, the COO of FXOpen UK, as he breaks down the most significant news reports and shares his expert insights.
- Nasdaq Composite: Worst Session

Analysis of AUD/USD: Exchange Rate Falls to Early May Low
As indicated by the 4-hour AUD/USD chart today:
→ the rate fell below 0.652, a level last seen on May 2;
→ the RSI indicator dropped below 15, a level last seen during the panic over the spread of COVID-19

Analysis of AMZN Stock: Price at 1.5-Month Low
As shown in the AMZN chart, the stock price dropped below:
→ the psychological level of $180;
→ the mid-June interim low.
The last time AMZN traded below $180 was in early June.
Thus, AMZN has faced sell-offs, similar to other tech