


FXOpen

The Securities and Exchanges Commission decided to reject the first US bitcoin ETF. Prices initially crashed on the decision but quickly recovered. Litecoin fell on the ETF decision as well but it later recovered all losses.
SEC Rejects Bitcoin ETF
The US Securities and Exchanges Commission decided to reject a rule change that would permit the listing of the first US bitcoin ETF. Prices initially crashed by over $200, from $1246 to a low of $1,040 on FXOpen. Other exchanges saw similar 20% declines.
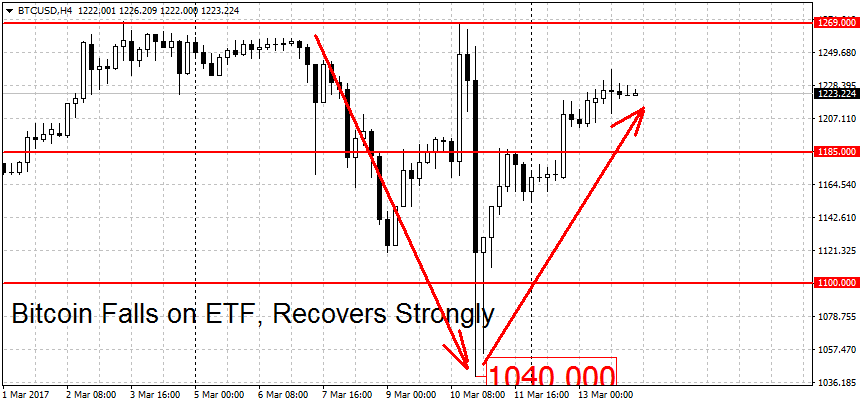
But as you can see on the chart above, the drop was used by bulls to ‘buy the dip’. We’re currently quoted at $1,223 on FXOpen/BTC-E, only 1.8 percent below the pre-ETF news price.
According to the SEC, a major reason for disapproving the ETF was the influence of unregulated markets on the bitcoin price. Gemini, the exchange that was to be used as a reference point for the ETF, is itself regulated but large swaths of the overseas markets remain unregulated.Therefore, the SEC continues:
”As the Exchange has not entered into, and would currently be unable to enter into, the type of surveillance-sharing agreement that has been in place with respect to all previously approved commodity-trust ETPs, agreements that help address concerns about the potential for fraudulent or manipulative acts and practices in this market”
This means that all other bitcoin ETFs in the pipeline are now dead in the water as well, at least for the foreseeable future.
With the break below the $1,100 mark we are now back into neutral mode. A new rally requires a breakout above this month’s high. While this is $1,269 on FXOpen, on other exchanges prices spiked to $1,330-$1,360 on Friday before the news release. On the lower end we have support at the ETF spike low of $1,040. But a new downtrend will not be in place until the $1,000 round figure is taken out on the major BTC exchanges.
Litecoin Remains in Rally Mode
Litecoin prices fell along with bitcoin on the ETF decision. But they have since rebounded strongly. Yesterday we got a major move from $3.85 to a high of $4.48 but things cooled off later on. No news can be attributed to this rally. We are currently quoted near the 50% retracement of yesterday’s move.
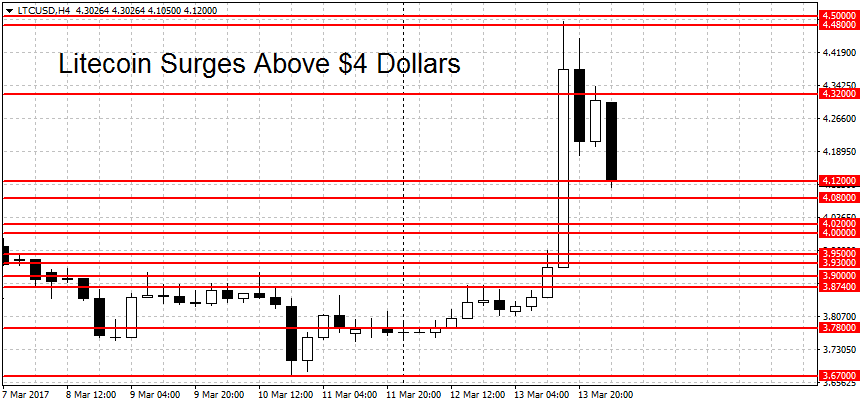
To end the current uptrend the bears will have to push LTC/USD back below the post-ETF lows at $3.67 dollars per coin. This would also start a new LTC downtrend. Above current prices weak resistance can be found at the March 2nd swing high of $4.32, closely followed by yesterday’s high at $4.48 and the $4.50 round figure.
FXOpen offers the world's most popular cryptocurrency CFDs*, including Bitcoin and Ethereum. Floating spreads, 1:2 leverage — at your service. Open your trading account now or learn more about crypto CFD trading with FXOpen.
*At FXOpen UK and FXOpen AU, Cryptocurrency CFDs are only available for trading by those clients categorised as Professional clients under FCA Rules and Professional clients under ASIC Rules respectively. They are not available for trading by Retail clients.
This article represents the opinion of the Companies operating under the FXOpen brand only. It is not to be construed as an offer, solicitation, or recommendation with respect to products and services provided by the Companies operating under the FXOpen brand, nor is it to be considered financial advice.
Stay ahead of the market!
Subscribe now to our mailing list and receive the latest market news and insights delivered directly to your inbox.

Latest articles

Weekly Market Wrap With Gary Thomson: Nasdaq, EUR/USD, USD/CHF, Brent Crude Oil, Googl Shares
Get the latest scoop on the week's hottest headlines, all in one convenient video. Join Gary Thomson, the COO of FXOpen UK, as he breaks down the most significant news reports and shares his expert insights.
- Nasdaq Composite: Worst Session

Analysis of AUD/USD: Exchange Rate Falls to Early May Low
As indicated by the 4-hour AUD/USD chart today:
→ the rate fell below 0.652, a level last seen on May 2;
→ the RSI indicator dropped below 15, a level last seen during the panic over the spread of COVID-19

Analysis of AMZN Stock: Price at 1.5-Month Low
As shown in the AMZN chart, the stock price dropped below:
→ the psychological level of $180;
→ the mid-June interim low.
The last time AMZN traded below $180 was in early June.
Thus, AMZN has faced sell-offs, similar to other tech