


Slow Bitcoin Rally Continues
FXOpen
The slow rally in bitcoin prices continues. In the past seven days everyone’s favorite crypto-currency advanced by $10 dollars or 2.2 percent. This is having a positive impact on most of the altcoin market. Litecoin for example is up by 32 cents or over 8 percent.
Slow Bitcoin Rally Continues
The slow rally in BTC/USD continues. Like we mentioned above the gains are not very large at around 2 percent this week, from $445 to $455 dollars per coin. On the technical front not much is changed. The small percentage move hasn’t broken any major levels. The short-term trend is bullish as is the medium-term trend. The long-term trend (monthly charts) is still in neutral mode.
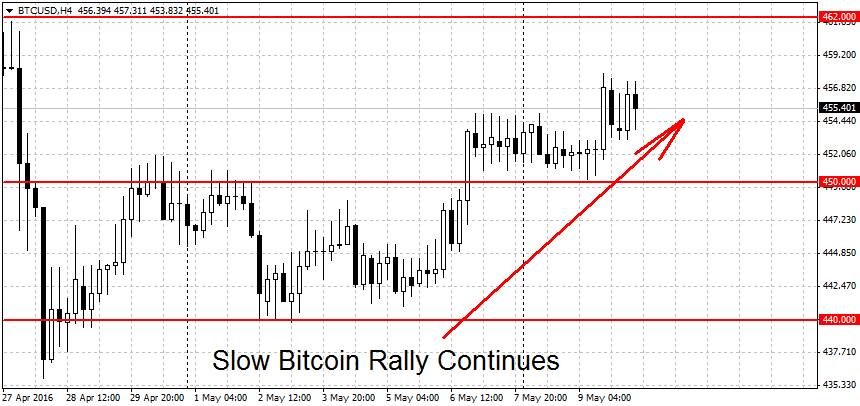
The key resistance area remains at $461-$465 on Fxopen and $470-$475 on other bitcoin exchanges. A decisive breakout above this important resistance may lead to sharp gains toward the $500 round figure. This was last year’s high for BTC on most major exchanges. A clean break above it could intensify the rally.
On the other end, a breakdown below $440 may end the current uptrend. Weak support below here can be found at the recent swing low at $435 dollars. A clean break of this low may switch the short-term trend to the downside. Resistance turns to support and the breakout point for the rally near $426 dollars may give a helping hand to the bulls.
More levels on the downside include the $412 swing low and the round $400 figure. These are followed by $394 dollars (weak level) and $374 dollars per coin. This year’s low for bitcoin is at $349.82, another potential support.
More Gains for Litecoin
Litecoin continues to gain ground. This week the altcoin is up by 32 cents or 8.5 percent. The crypto has outperformed bitcoin since its breakout around $3.26 dollars per coin. Similarly to big brother, for LTC both the short-term and medium-term trends are up while the long-term trend is neutral.
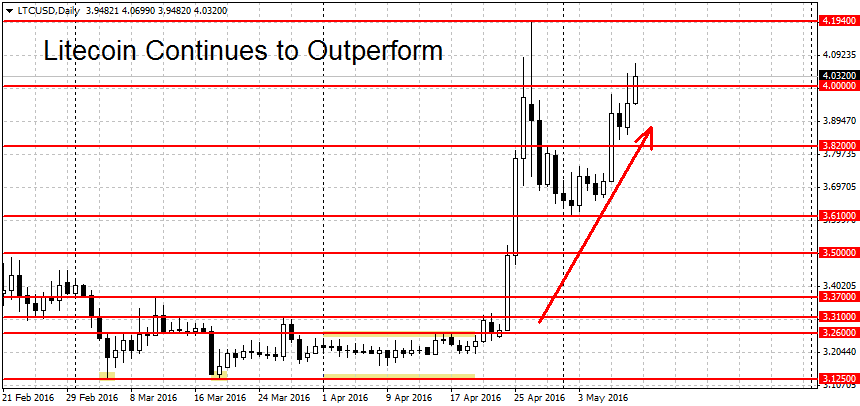
The first notable resistance lies at the $4.19 dollars swing high. Above here we have the round $4.50 figure, followed by the $4.85 swing high. Higher up we have another round figure at $5 dollars. From here we find a large gap to the next level at $8.64 dollars (last year high) but as we’ve written previously, some resistance levels are likely to emerge in-between. Potential candidates here include the round figures at $6, $7 and $8 dollars per coin.
On the downside, a decisive break below the latest swing low at $3.61 dollars would end the current rally. You can see more support levels on the chart above.
FXOpen offers the world's most popular cryptocurrency CFDs*, including Bitcoin and Ethereum. Floating spreads, 1:2 leverage — at your service (additional fees may apply). Open your trading account now or learn more about crypto CFD trading with FXOpen.
*Important: At FXOpen UK, Cryptocurrency trading via CFDs is only available to our Professional clients. They are not available for trading by Retail clients. To find out more information about how this may affect you, please get in touch with our team.
This article represents the opinion of the Companies operating under the FXOpen brand only. It is not to be construed as an offer, solicitation, or recommendation with respect to products and services provided by the Companies operating under the FXOpen brand, nor is it to be considered financial advice.
Stay ahead of the market!
Subscribe now to our mailing list and receive the latest market news and insights delivered directly to your inbox.


Latest articles

DAX 40: consolidation amid technology sell-off
A wave of selling in the technology sector that emerged earlier this week has weighed on European equities. The trigger was investor concern over the profitability of large-scale debt-funded investments by major US tech companies in AI infrastructure. The Nasdaq

Euro Hits Fresh Yearly Lows Amid Dovish ECB Signals
The euro remains under pressure following weak macroeconomic data from the euro area and fresh signals that the European Central Bank is prepared to maintain a more accommodative monetary policy stance. Data released yesterday pointed to a deterioration in business

Pound at Key Levels: Markets Assess Impact of Political Uncertainty in the UK
The British pound remains under pressure following increased political uncertainty in the United Kingdom triggered by the Prime Minister’s resignation. Investors are assessing potential shifts in the political and economic policy outlook after the head of government stepped down,