


Some Gains Across Crypto Market
FXOpen
The crypto market is seeing some gains across the board. Bitcoin is up to $6,700 from $6,315 dollars and LTC is at $97 dollars, up from $93 dollars last week.
Bitcoin Higher but Downtrend Remains
Bitcoin is up 6 percent by since our last update. Prices bottomed out at $6,129 dollars last week, very close to the all-time low for BTC/USD at $5,980 dollars.
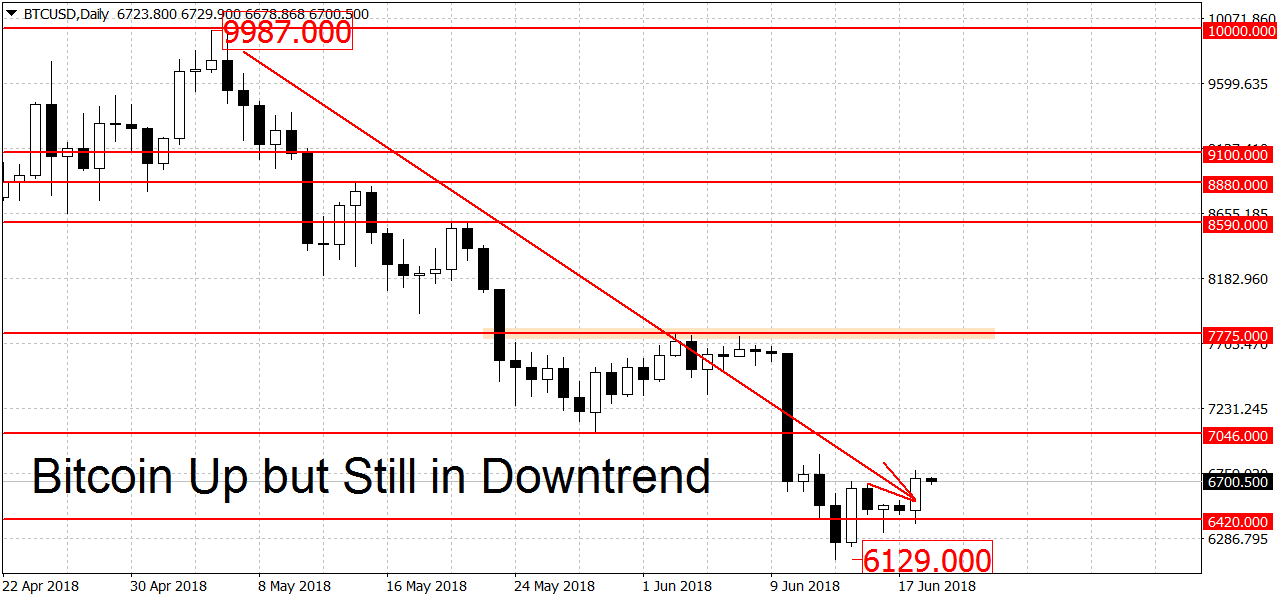
However despite the gains the downtrend on the daily charts remains. To end it the bulls will have to take us above the $7,775 swing high. A move above here would also restart the rally. Higher up there’s more resistance at $8,590 and 8,880 dollars per coin. The $10,000 round figure is another notable resistance level. A clear breakout above could lead to further gains.
On the downside we have double bottom support around the 2018 low at $5,980 dollars. A decisive breakdown below this area of support could see us test the next important level at $5,000 dollars. A clean break below here would exacerbate BTC losses. We have no change on the longer-term charts again, which is to be expected given the lower volatility seen during the preceding week. We are still range-bound on the weeklies and bullish on the monthlies.
Litecoin up by 4 Percent
Litecoin is trading higher by 4 percent, from $93 to $97 dollars per coin. But similarly to BTC, LTC too is still in a downtrend.
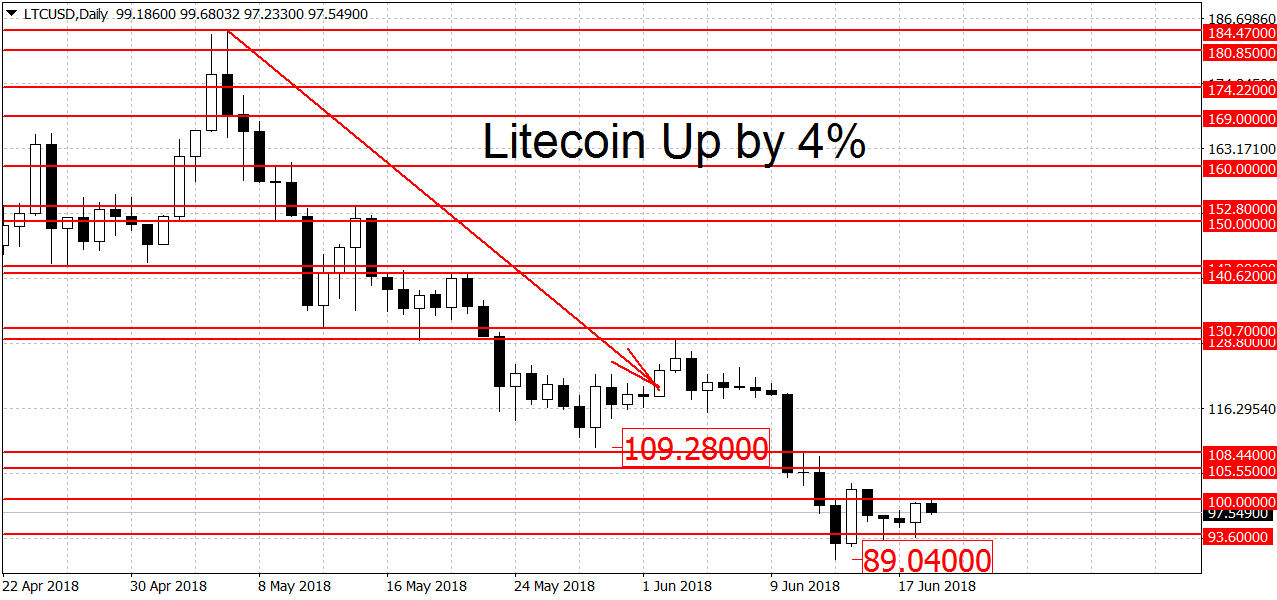
A breakout above $121 dollars is needed to end the current bearish trend. But a new rally requires a move above the swing high at $128.80 dollars. Resistance higher up can be found around the round figures of $140 and $150 dollars, followed by the $152.80 swing high. As you can notice the important levels for both BTC and LTC haven’t changed much since last week as the market stayed relatively calm.
On the lower end there’s weak support around $89 dollars but the first major level can be seen around the $70 dollars mark. Further down the 2013 high at $48.40 dollars together with the $50 round figure form the next area of notable support. Of course its possible that prices will stop/stall before we hit $70 or $50 dollars. But those are the important levels that we see on the charts right now. On the longer-term charts LTC/USD is mixed, bearish on the weeklies but bullish on the monthly charts.
Open a Crypto account and start BTC trading with FXOpen
FXOpen offers the world's most popular cryptocurrency CFDs*, including Bitcoin and Ethereum. Floating spreads, 1:2 leverage — at your service (additional fees may apply). Open your trading account now or learn more about crypto CFD trading with FXOpen.
*Important: At FXOpen UK, Cryptocurrency trading via CFDs is only available to our Professional clients. They are not available for trading by Retail clients. To find out more information about how this may affect you, please get in touch with our team.
This article represents the opinion of the Companies operating under the FXOpen brand only. It is not to be construed as an offer, solicitation, or recommendation with respect to products and services provided by the Companies operating under the FXOpen brand, nor is it to be considered financial advice.
Stay ahead of the market!
Subscribe now to our mailing list and receive the latest market news and insights delivered directly to your inbox.


Latest articles

Apple: Earnings Day Above the Activity Zone
On 30 April, after the market close, Apple Inc. will release its financial results for the second quarter of fiscal 2026. The consensus forecast, based on estimates from 31 analysts, points to revenue of around $109.7 billion, with expected

USD/JPY and USD/CHF Near Key Levels: The Dollar Supported by the Fed
The US dollar continues to trend upwards following the Federal Reserve meeting, drawing support from the regulator’s moderately hawkish stance and comments by Jerome Powell. Markets interpret the Fed’s rhetoric as a signal that restrictive policy is likely

EUR/USD and GBP/USD consolidate ahead of the Fed decision
European currencies are showing subdued dynamics, entering a consolidation phase following their previous advance. Earlier, EUR/USD and GBP/USD broke out of their ranges and strengthened; however, the subsequent correction has led both pairs to retest the previously breached