


Theories of Technical Analysis
FXOpen
Dive deep into the intricacies of technical analysis with a close examination of five pivotal theories of technical analysis — Dow, Wyckoff, Gann, Elliott, and Merrill. Unravel their foundational concepts, applications, and histories to gain a comprehensive grasp of market dynamics with this article.
Dow Theory
The Dow Theory, attributed to Charles Dow, lays out foundational concepts that many traders consider the basic principles of technical analysis. It postulates that stock market activities unfold in specific, non-random patterns influenced by human psychology. These patterns manifest in three primary movements: long-term trends, counter-trends, and daily fluctuations. Dow emphasised that market prices integrate all existing and foreseeable data. Consequently, established trends tend to endure until clear signs indicate their reversal.
How It's Used
Traders utilise the Dow Theory to recognise and confirm market trends. By distinguishing between primary and secondary movements, they can identify the overarching trend and any counter-trends or corrections within it. This distinction aids in making informed trading decisions, such as entering or exiting trades at optimal points. By watching for definitive signals that indicate trend reversals, traders can position themselves advantageously for potential upcoming market shifts.
How It Was Developed
The genesis of the Dow Theory rests in the series of editorials penned by Charles Dow for The Wall Street Journal. Through his keen observations of market movements and trends, he devised certain principles that eventually coalesced into the Dow Theory. Though Dow himself never consolidated his ideas into a singular "theory," his successors refined his observations into the framework recognised today.
Wyckoff Method
The Wyckoff Method delves deep into the interplay between supply and demand in the stock market, underpinned by the assertion that assets move in cycles propelled by institutional investors or "smart money." The method suggests that by grasping the motives and behaviours of these major institutional actors, traders gain an edge, given that these entities notably shape market trends.
How It's Used
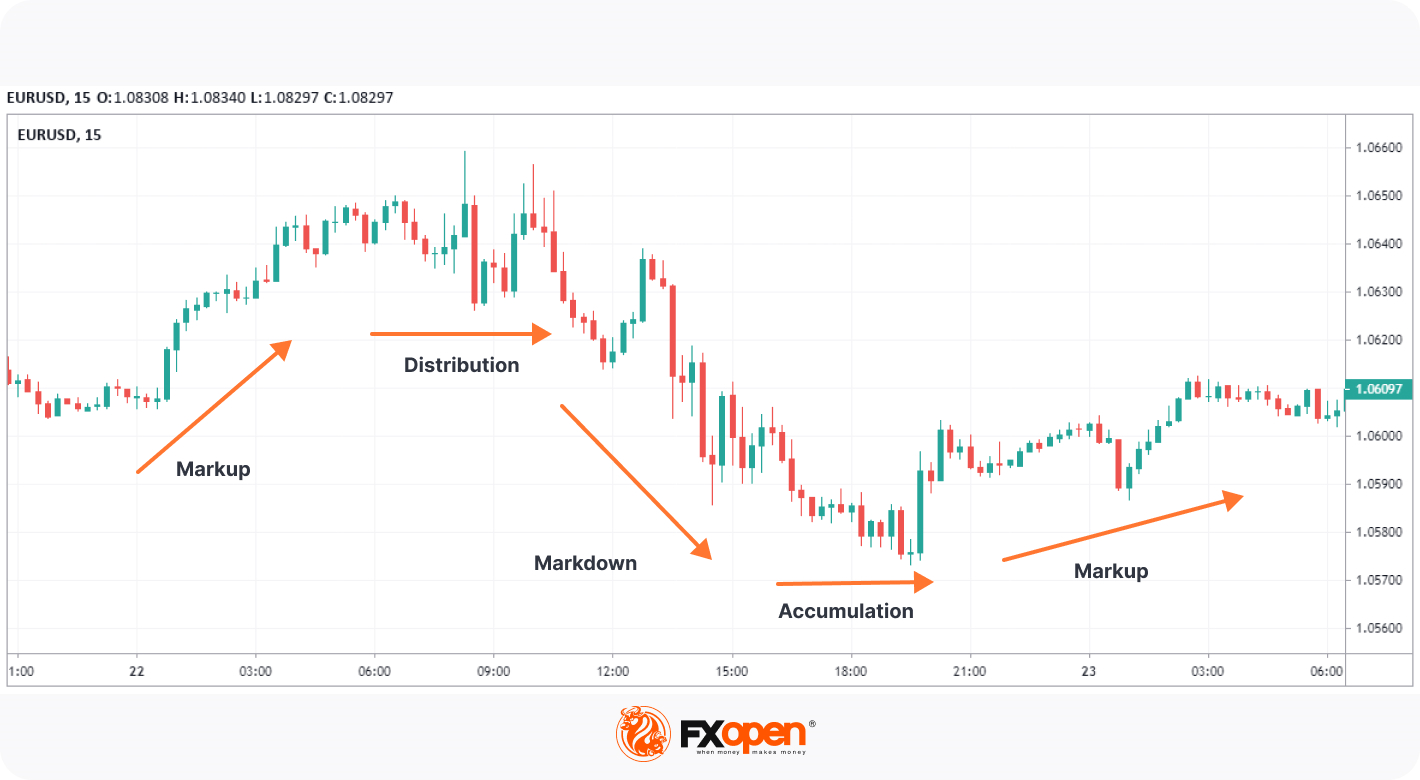
The Wyckoff Method prioritises the relationship between price and volume. Traders, armed with this method, keenly observe price movements in relation to volume surges or declines, seeking clues to the actions of institutional players. By recognising accumulation (where "smart money" accumulates assets) and distribution (where assets are offloaded) phases, traders can discern potential future price directions.
The method employs a systematic approach: defining current market trends, anticipating future movements by tracking institutional behaviour, and finally, establishing positions in harmony with these insights. Specific chart patterns, like springs or upthrusts, are signals used to validate the ongoing phase.
How It Was Developed
Richard D. Wyckoff, recognising the disadvantage at which retail traders often found themselves, embarked on a journey to level the playing field. He rigorously studied the strategies employed by the most successful traders of his time. Merging these findings with his own market observations, Wyckoff birthed a method that sought to illuminate the operations of the market's most influential players.
Gann Theory
The Gann Theory is an intricate system of technical analysis developed by W.D. Gann. It’s grounded in the belief that price and time are intrinsically interwoven, and this relationship can be harnessed to predict future price movements. Gann maintained that markets move in consistent patterns and rhythms, and by understanding these, traders can foretell potential price changes.
How It's Used
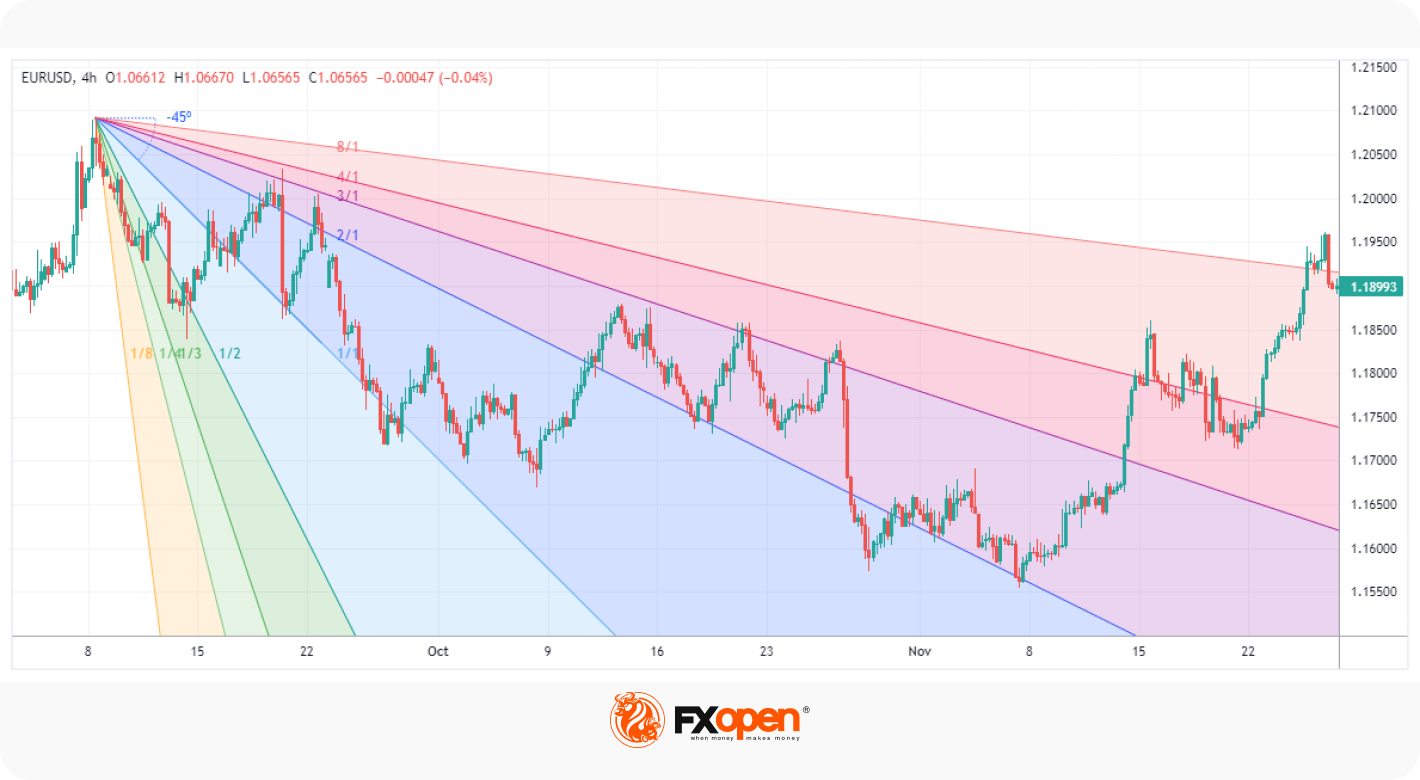
Traders employing the Gann Theory use a set of bespoke tools to decipher market behaviour. Among the most notable are the Gann angles, which are drawn between a significant bottom and top (or vice versa) at various predetermined angles.
The Square of Nine, another Gann tool, is a root square that offers a horizontal and vertical axis, assisting traders in identifying price movements and potential turning points. Lastly, the Gann Fan is used to foresee areas of support and resistance by marking out angles that depict possible future price movements. By using these tools, traders attempt to pinpoint where the price might change direction, offering them strategic entry and exit points.
You can find all of these tools and more in FXOpen’s free TickTrader platform. Head over there to get started in minutes.
How It Was Developed
W.D. Gann integrated ancient mathematics, geometry, and astrology to decode market movements. This synthesis resulted in the Gann Theory, a set of tools and techniques. His innovative approach significantly influenced technical analysis. His meticulous research and unique approach have rendered his contributions both legendary and influential in the realm of technical analysis.
Elliott Wave Theory
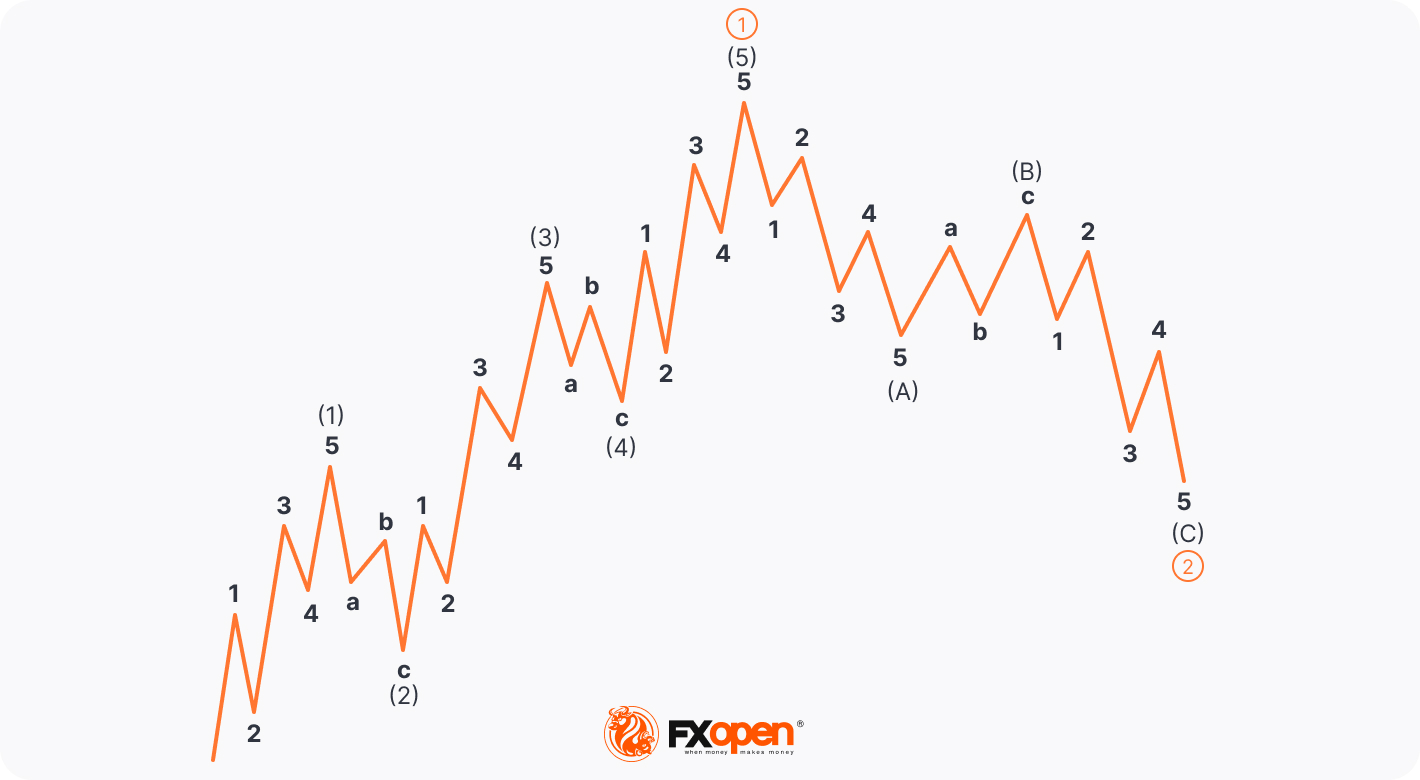
The Elliott Wave Theory, introduced by Ralph Nelson Elliott, posits that market movements manifest in specific, predictable wave patterns. Central to this framework is the belief that markets progress in a five-wave sequence and retract in a three-wave sequence, totalling an eight-wave cycle. This sequence is driven by collective investor psychology, oscillating between optimism and pessimism.
How It's Used
In application, traders deploy the Elliott Wave Theory to both decipher and forecast market trajectories. By discerning where they are within a particular wave sequence, they can anticipate the likely next move of the market. For instance, recognising the commencement of a third wave — typically the most robust and longest — can signal a strong trading opportunity. Conversely, identifying the start of a corrective wave can guide traders to defensive positions.
How It Was Developed
In the 1930s, Ralph Nelson Elliott identified recurring stock market patterns, suggesting predictability rather than randomness. He believed these patterns were fractal—repetitive at different scales. His research led to the Elliott Wave Principle, which provides a lens to understand and forecast market behaviour based on these wave patterns.
Merrill Patterns
Merrill Patterns, formulated by Arthur A. Merrill, are a collection of geometric formations discerned within stock market charts. These patterns reflect the collective psyche of market participants and underscore the principle that markets evolve in discernible trends. Merrill meticulously identified 32 W- and M-shape patterns, such as wedges, triangles, and head-and-shoulders formations, each harbouring unique predictive capacities about future price movements.
How It's Used
Traders leverage Merrill Patterns to gain insights into potential market shifts. By recognising the formation of a specific pattern, a trader can anticipate possible trend reversals or continuations. For instance, the emergence of a head-and-shoulders pattern can often indicate a forthcoming downward market reversal. On the other hand, a triangle formation typically signals the continuation of a prevailing trend. These patterns serve as visual cues, guiding traders in establishing their market positions.
How It Was Developed
Arthur Merrill extensively studied stock charts for decades, identifying recurring predictive patterns. He consolidated these findings into a compilation of patterns with defined rules. His work, "Behavior of Prices on Wall Street," systematically presents these insights, marking a significant contribution to technical analysis.
Final Thoughts
In understanding what technical analysis is in the stock market, these five theories are an ideal place to start. Each offers powerful, time-tested insights that provide a much deeper understanding of market dynamics than mere indicators or candlestick patterns. However, these theories are also used in other markets, including forex and commodities. To harness the power of these insights practically, consider opening an FXOpen account for a seamless trading experience.
This article represents the opinion of the Companies operating under the FXOpen brand only. It is not to be construed as an offer, solicitation, or recommendation with respect to products and services provided by the Companies operating under the FXOpen brand, nor is it to be considered financial advice.
Stay ahead of the market!
Subscribe now to our mailing list and receive the latest market news and insights delivered directly to your inbox.


Latest articles

Nasdaq 100: 48 Hours of Chaos, One Trendline Standing in the Way
Wall Street just lived through one of its wildest 48 hours of the year. On Wednesday, the Fed held rates steady at 3.50%-3.75%, but three FOMC members broke ranks to demand a hike—an unusually hawkish dissent

Amazon Analysis: Strong Earnings Coincide with a Breakout from the Correction
On 30 July, Amazon.com reported its financial results for the second quarter of 2026, significantly exceeding market expectations. Revenue rose 20% year-on-year to $200.6 billion, compared with the consensus forecast of around $196.5 billion. The main growth

GBP/USD and EUR/GBP Await Key Bank of England Decision
The pound strengthened following the outcome of the US Federal Reserve meeting, where the central bank, as expected, kept interest rates unchanged. However, the Fed did not provide the market with clear signals of an imminent shift towards rate cuts,