


What Are 5-minute Trading Strategies Traders Use?
FXOpen

Scalping is a popular approach in Forex trading, as many traders don’t want to wait for potential rewards. It involves numerous short-term trades on low timeframes, including 1, 5, and 15-minute charts. However, scalping is challenging. It requires significant funds, lots of experience, and a well-developed plan that will allow traders to reach a considerable success rate. Below you will find three effective scalping strategies for a 5-minute chart.
1. Momo Strategy
Momo is a momentum reversal strategy. The idea is to define strong momentum on a price chart that would support the reversal and a price explosion. If you look for a 5-minute Forex scalping strategy on the Internet, it’s likely this will be the first one you will find.
Setup
The strategy is based on EMA (exponential moving average) and MACD (moving average convergence divergence) signals. It’s assumed that a trader would replace a simple moving average with an exponential one because the latter puts more weight on the most recent prices. It makes EMA more sensitive and more responsive to the current market conditions. Therefore, the exponential moving average may be considered the best moving average for a 5 min chart. A 20-period moving average will suit best.
The MACD indicator is based on the exponential moving averages. Usually, it consists of two lines and a histogram. In this strategy, traders only use the histogram. MACD is applied to the chart with its standard parameters of fast EMA with a period of 12, slow EMA with a period of 26, and a signal line with a period of 9, all calculated on close prices. When discovering all strategies in the articles, you will notice that standard parameters are the best MACD settings for a 5 minutes chart.
Entry
- Long. The approach is based on a market setup when the price breaks above the EMA, while the MACD indicator is either above the zero line for the last 25 minutes or is crossing the zero line from bottom to top. A trader may consider opening a buy position after the price moves 10 pips from the EMA crossover.
- Short. A price is expected to fall after it crosses the 20-period moving average from top to bottom and the MACD indicator has been below the zero line for the last 25 minutes or is breaking below the zero line. A trader can look to place a sell order once the price falls by 10 pips from when it crossed the EMA.
Take profit
- Long. A trailing take-profit order might work for this approach. A trader can close the first half of the trade at the level equal to the entry point plus the difference between the entry point and the stop-loss level. The second half could be closed when the MACD indicator falls below the zero line.
- Short. A trailing take-profit order may also work for a sell trade. The strategy suggests closing half of the position once the price moves the entry value minus the difference between the entry point and the stop-loss level. You may choose to close the whole trade if the MACD rises above the zero line.
Stop loss
- Long. A stop-loss (SL) order for the first half of the trade could be placed at a swing before the price breaks above the EMA. To further limit risks, an SL could be placed 10 pips below the moving average value at the entry. After the first half is closed, the stop-loss level might be trailed five pips below the take-profit level of the first half.
- Short. An SL level for the first half of the position might be placed at a swing before the price crosses the moving average or is 10 pips above it. A new value of the SL after the trade is partially closed might equal the take-profit level of the first half plus five pips.
Example
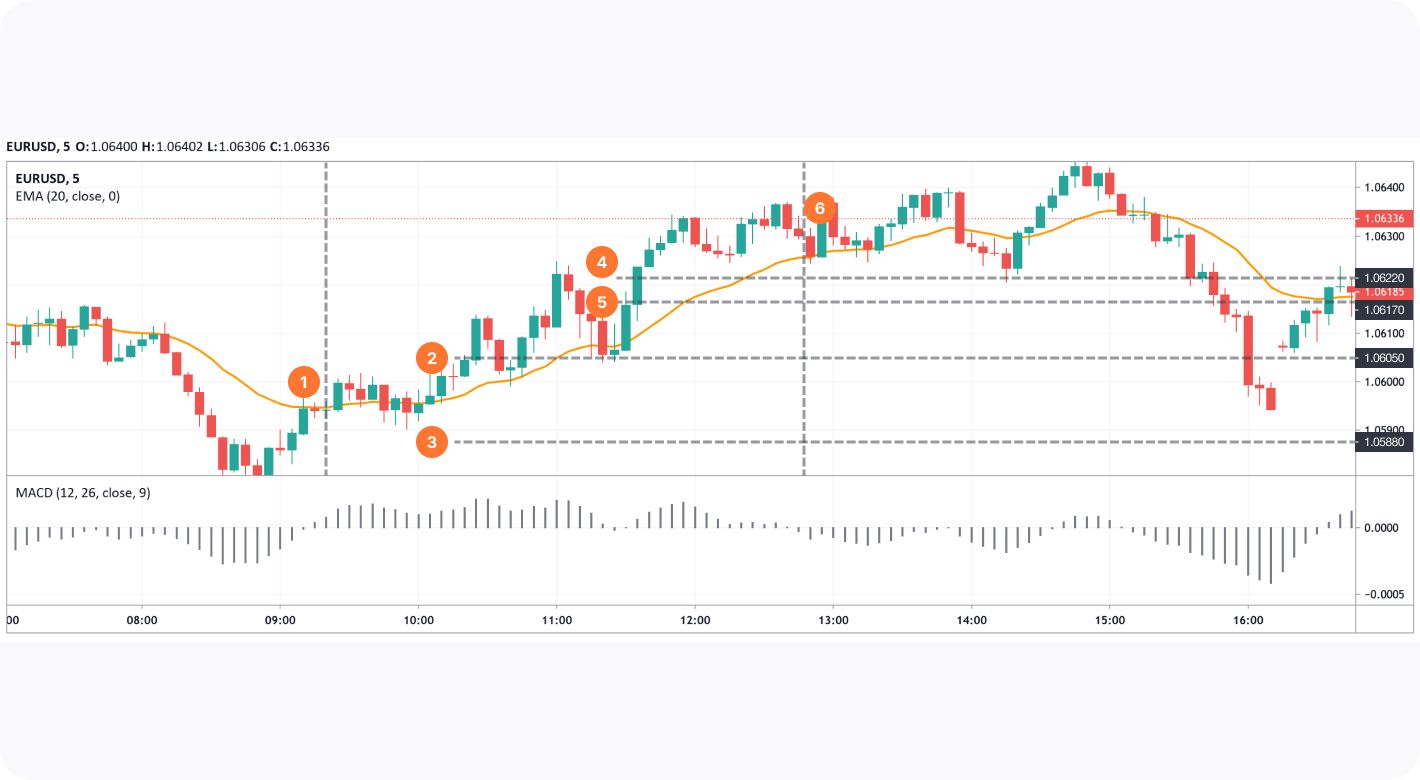
Look at the chart above. A buying opportunity occurred after the price closed above the exponential moving average and the MACD indicator broke above the zero line (1). As a crossover took place at 1.0595, therefore, you could go long at 1.0605 (2). A stop-loss order could be placed at 1.0588, which is an EMA value at the entry point minus 10 pips (3). The first half of the trade could be closed at 1.0622 (4), which is an entry point of 1.0605 plus (1.0605 - 1.0588). An SL for the second half could be moved to 1.0617, which is a first take-profit target minus five pips (5). A trader could close the whole position around 1.0632 when the MACD falls below 0 (6).
You can try different indicator settings on the TickTrader platform.
2. EMA and RSI
The exponential moving average is a beloved indicator for 5-minute trades. Still, on Forex, a 5 min scalping strategy may include other tools to either confirm signals or find new ones. For this trading approach, we will add the RSI indicator. Its main purpose is to identify overbought and oversold conditions.
Setup
This strategy includes three exponential moving averages with periods of 9 (moving average 1), 55 (moving average 2), and 200 (moving average 3). The RSI setup should include a middle line of 50 as opposed to standard 30 and 70 levels.
Entry
- Buy. A buy trade may be initiated when moving average 1 breaks above moving average 2, which is already above moving average 3. The RSI indicator should be above the level of 52.
- Sell. Sell opportunities appear when moving average 1 is below moving average 2, which is already below moving average 3. RSI should move below the level of 48.
Take profit
- Buy. According to the strategy, a trader could close a position as soon as the RSI indicator forms new maximums compared to the highs formed when the buy opportunity occurred.
- Sell. For a sell position, traders could consider closing a trade after the RSI indicator sets new minimums compared to the lows formed when the sell opportunity occurred.
Stop loss
- Buy. Traders could use the closest resistance level as a stop-loss target.
- Sell. Traders could consider the closest support as a stop target.
Example
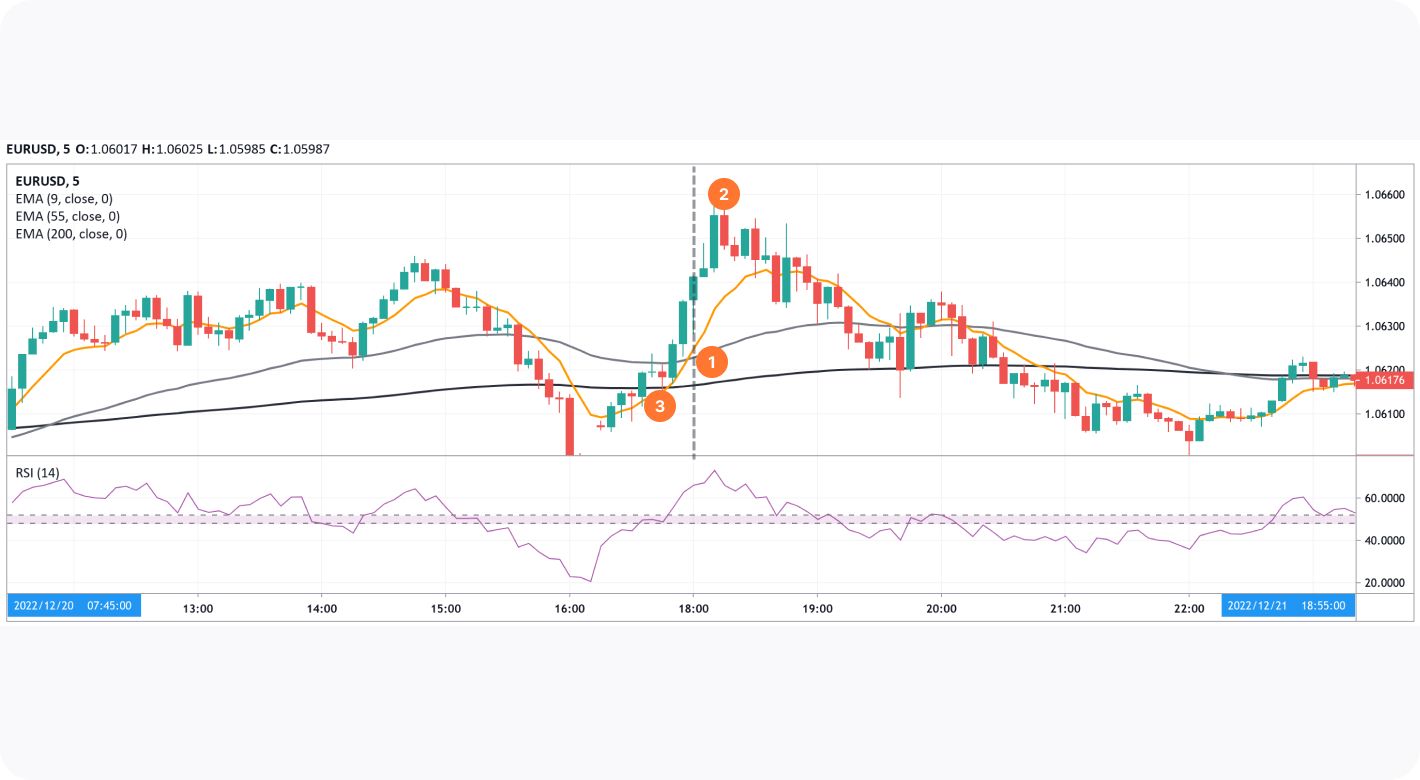
The chart above shows a possible buy position. The 9-period EMA crossed the EMA with a period of 55, which was already above the 200-period EMA at around 1.0622 (1). The RSI indicator was above the 52 level, which initiated a buy condition. A trader could exit the market with a profit as soon as the RSI forms a higher high (2), which happened at around 1.0658. To limit risks, they could use the closest support level, which lies at 1.0618 (3).
3. EMA, MACD, and Bollinger Bands
This is another 5 min trading strategy. It involves EMA, MACD, and Bollinger Bands.
Setup
The strategy includes:
- Exponential moving averages with periods of 5 and 20,
- Bollinger Bands with standard settings (length of 20 and standard deviation of 2),
- MACD with standard settings (fast EMA with a period of 12, slow EMA with a period of 26, and a signal line with a period of 9, all applied to close prices).
Entry
- Buy. Buying conditions may occur when the 5-period EMA crosses the 20-period EMA from bottom to top. Also, the strategy says that the price should be either near the lower band of the Bollinger indicator or near the middle line after crossing it from bottom to top. The MACD histogram should be above the zero line.
- Sell. You may go short after the EMA with a period of 5 falls below the EMA with a period of 20; the price should be either near the upper band of the Bollinger indicator or near the middle line after crossing it from top to bottom. The MACD histogram should be below the zero line.
Take profit
- Buy. You may close a buy trade once the MACD histogram sets a new high.
- Sell. You may close a sell position after the histogram sets a new low.
Stop loss
- Buy. The theory suggests that a stop-loss order could be placed seven pips below the closest support level. However, the distance could be increased or reduced depending on the market conditions.
- Sell. As for the sell position, traders also consider a 7-pip stop above the closest resistance level. But current market conditions determine actual order size.
Example
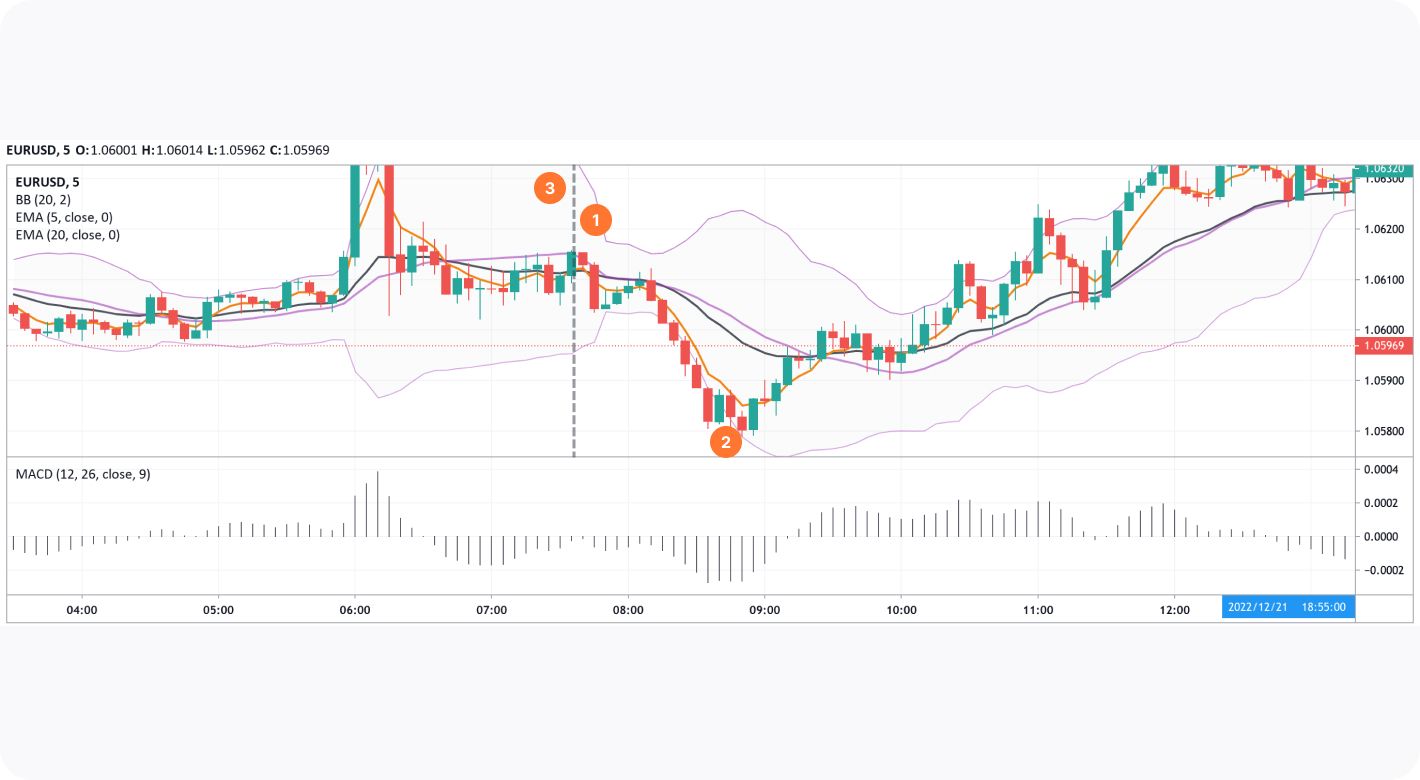
The chart above reflects a potential sell trade. The 5-period exponential moving average broke below the 20-period moving average, the MACD indicator was below 0, and the price was below the middle line of the Bollinger Bands indicator. A trader could enter the market at 1.0610 (1). The position could be closed when the MACD reaches a new low, which happened at around 1.0580 (2). A stop-loss target would be placed seven pips above the closest resistance level, which is 1.0622 (3).
How to Trade on 5-minute Timeframes
There is no perfect 5 min Forex trading system. It’s vital to evaluate current market conditions when setting entry and exit points.
- Overly wide stop-loss ranges may lead to losses if the market turns around unexpectedly, but overly narrow ranges are risky in a highly volatile market.
- Also, the price may fail to reach profit targets if the market is calm and there is a lack of liquidity, while unexpected events can lead to high volatility and a market reversal.
The best way to increase your chances of success is to practise. Try a free demo account by FXOpen to open risk-free trades.
This article represents the opinion of the Companies operating under the FXOpen brand only. It is not to be construed as an offer, solicitation, or recommendation with respect to products and services provided by the Companies operating under the FXOpen brand, nor is it to be considered financial advice.
Stay ahead of the market!
Subscribe now to our mailing list and receive the latest market news and insights delivered directly to your inbox.

Latest articles

GBP/CHF: Trendline or RSI — Which One Is Lying?
Sterling enters this week on firmer footing, with political uncertainty fading fast after Andy Burnham's confirmation as Labour leader eased investor concerns over the succession to Keir Starmer. Markets reacted further to reports pointing to Shabana Mahmood as the frontrunner

Silver Attempts to Break Out of Its Range
Silver continues to balance between its dual role as an industrial metal and so-called refuge asset, and this combination largely explains the lack of a clear trend in recent weeks. Shifting expectations for central bank interest rates can influence the

Nasdaq 100: Is This the Correction Traders Have Been Waiting For?
The Nasdaq 100 (US Tech 100 Mini on FXOpen) remains caught between two opposing forces: cooling inflation on one side, and persistent geopolitical instability on the other. On 14 July, June's CPI print came in softer than expected, easing near-term