


Triple Candlestick Patterns
FXOpen

Triple candlestick patterns are combinations of three candles, formed together. They are used in technical analysis to predict the direction in which the price of an asset is likely to move. They are essential tools for technical analysts in identifying potential reversals or the continuation of a trend. But, what are triple candlestick patterns, and how can you identify them?
What Are Triple Candlestick Patterns?
Triple candlestick setups are a group of three candlesticks that form a specific formation on charts of all assets, including currencies, stocks, ETFs, indices, commodities, and cryptocurrencies*.
They are considered to be strong buy or sell signals, depending on the setup. It is important to note that the formations are considered stronger if they occur after a prolonged trend. Additionally, traders use other technical analysis tools, such as support and resistance levels and indicators, to confirm these formations, and predict future price movements.
Top 6 Triple Candlestick Patterns
There are numerous triple candlestick patterns. Below, you will find six of the most popular and reliable ones.
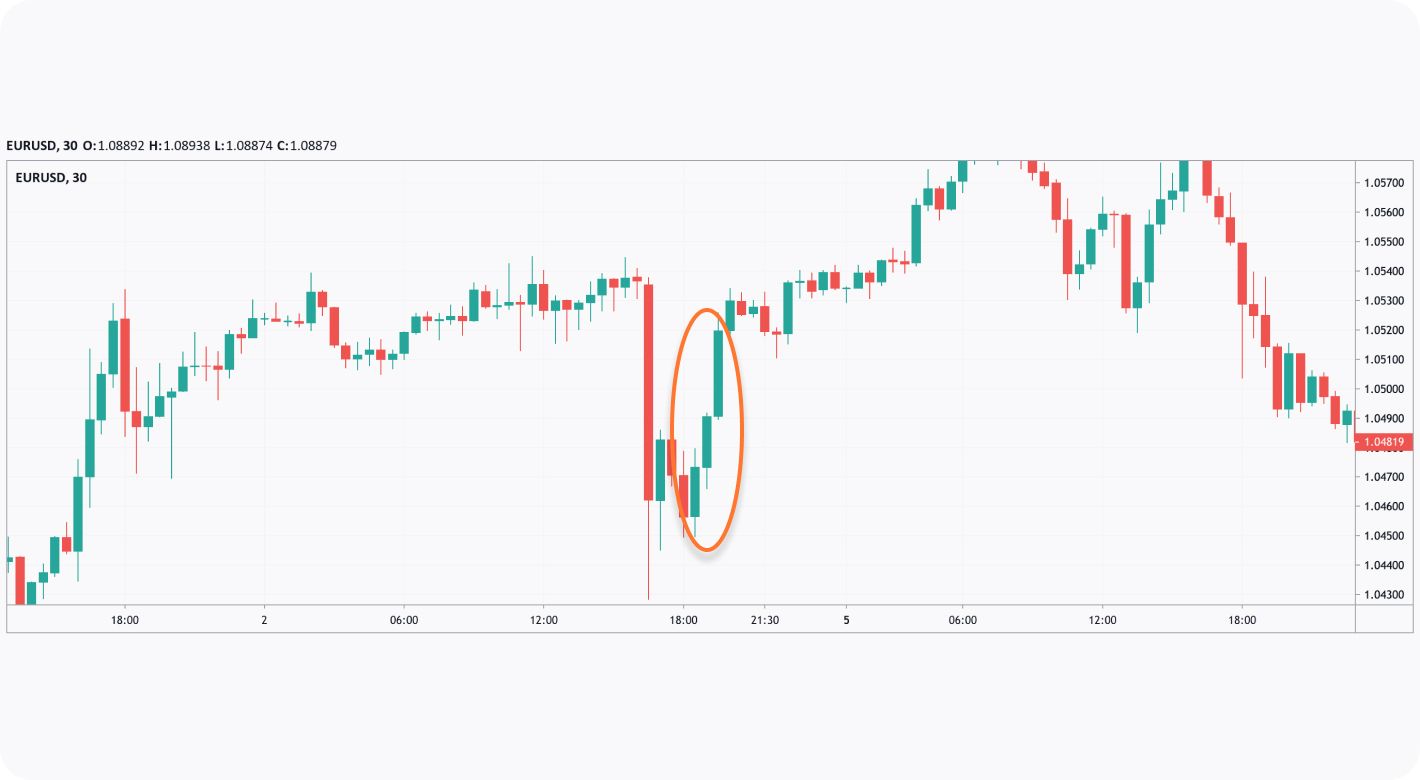
1. Three White Soldiers
Three White Soldiers are a bullish reversal setup and are formed at the end of a downtrend, when three consecutive bullish candlesticks appear with higher close prices, indicating a strong upward trend.
All three candles must have a long body and very small (or non-existent) upper shadows. Besides, all three candlesticks should open within the previous candle's real body and have a close exceeding the previous high, indicating the bulls are pushing the price up.
2. Three Black Crows
This setup is the opposite of the three white soldiers; it is considered bearish and is only formed at the end of an uptrend when three consecutive bearish candlesticks open within the previous candle’s real body and form lower close prices, indicating a strong downward trend. Each should have a long body with little to no existing shadow, indicating the bears are pushing the price down.
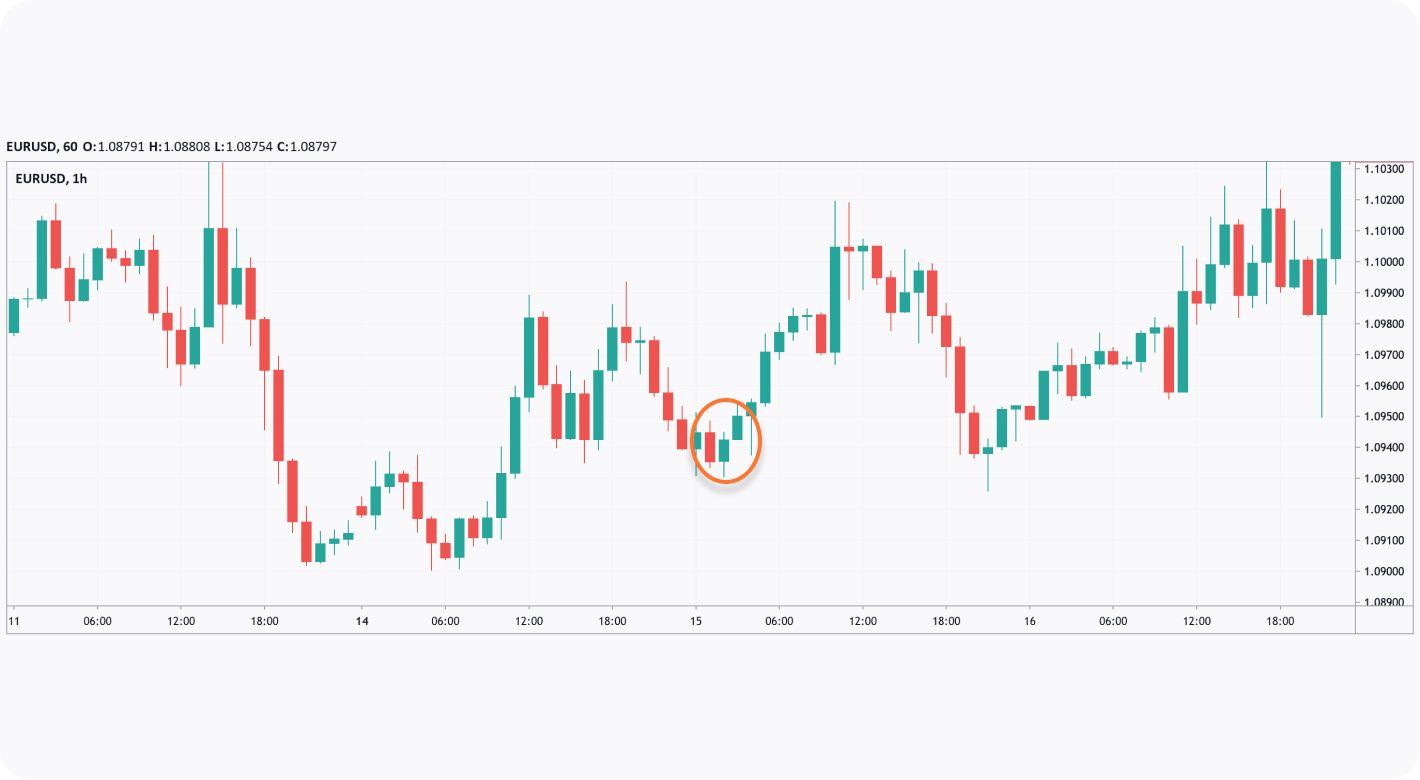
3. Three Inside Up
Three Inside Up is considered bullish and is formed at the end of a downtrend. In this formation, a bearish trading candle with a long body is followed by a bullish one, enclosed inside it. As for the third, it has to close above the close price of the second.
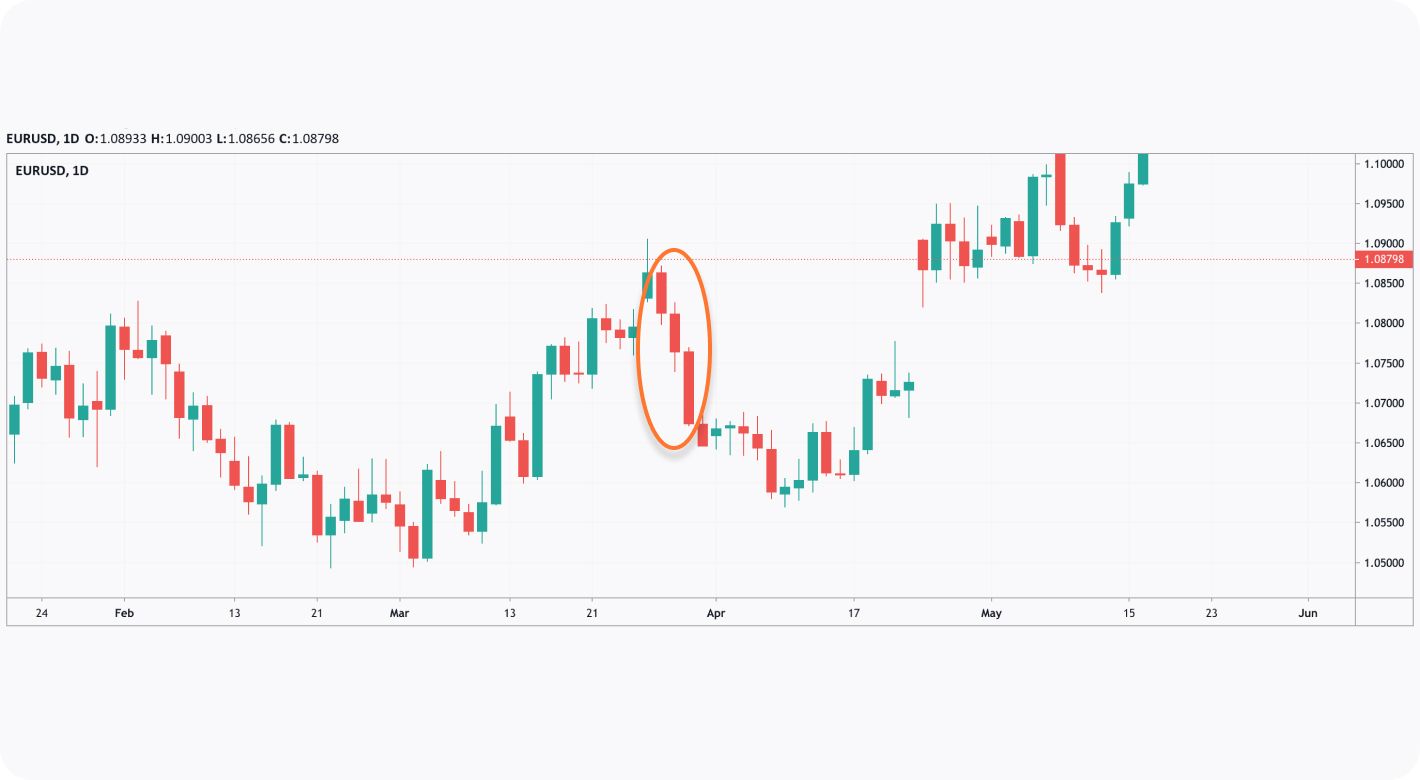
4. Three Inside Down
This setup is the opposite of the Three Inside Up, and is considered bearish.
It is formed at the end of an uptrend when a long bullish candlestick is followed by a bearish one that is contained within the body of the first candle. The third candle should close lower than the second.

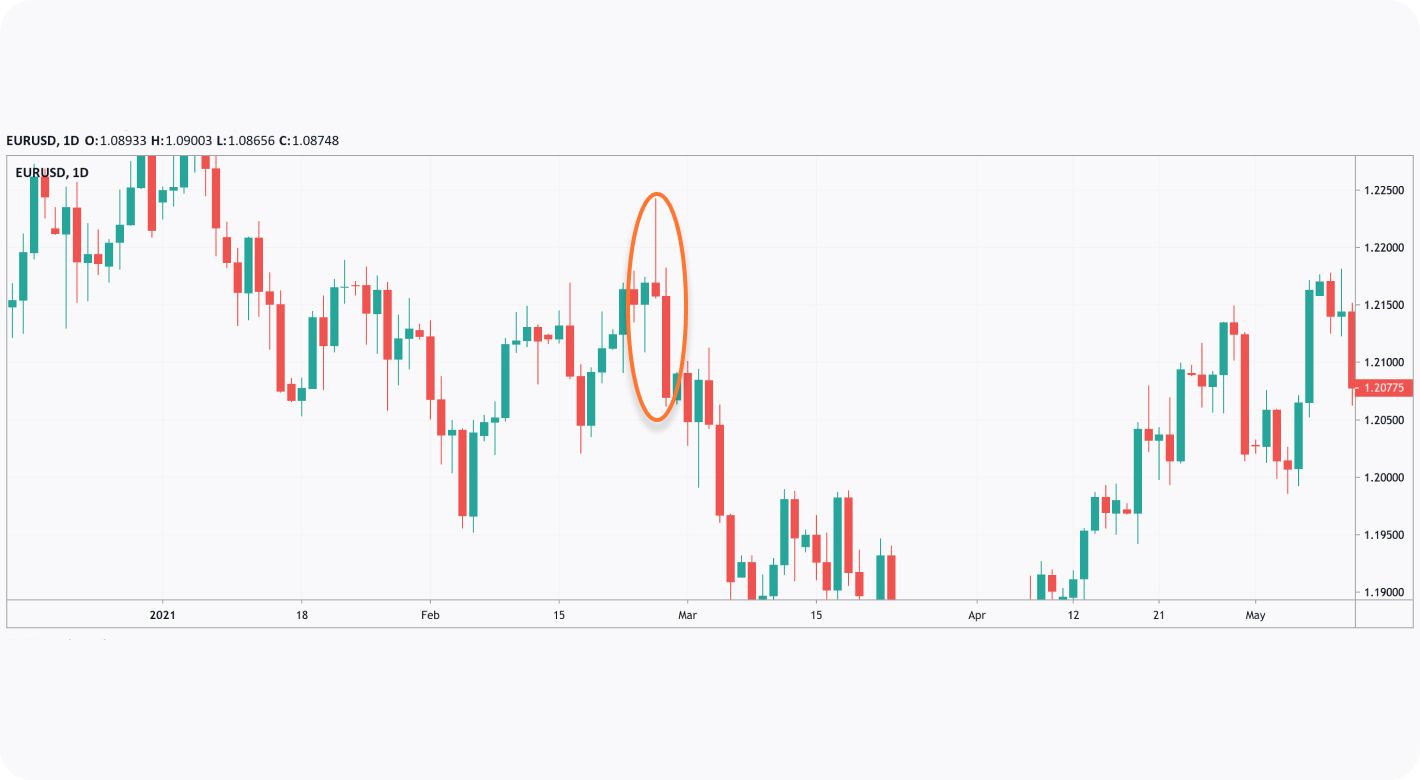
5. Evening Star
The evening star is a reversal setup formed at the end of an uptrend. It is composed of a first long bullish candle, a second one (can be bullish or bearish) with a smaller body that may gap above the previous, showing that the trend has not yet been decided, and a third bearish one, closing at least within the body of the first. This indicates the bulls are losing control and the bears are taking over, suggesting a potential reversal in the current uptrend.
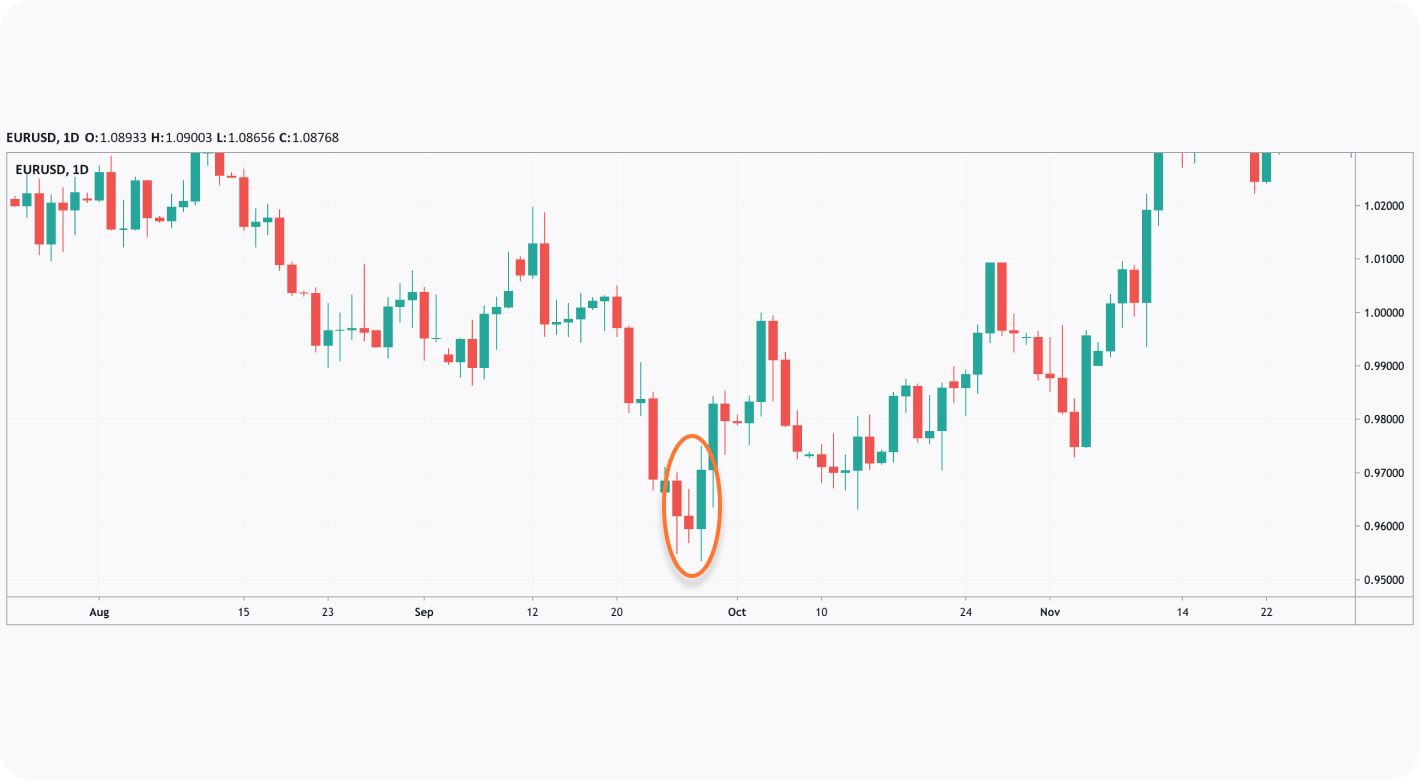
6. Morning Star
The morning star, the opposite of the evening star, is a reversal setup formed at the end of a downtrend. It is composed of a first long bearish candle, a second with a smaller body that gaps below the previous, and a third bullish candle, closing above the midpoint of the first. This indicates the bears are losing control and the bulls are taking over.
You could use the TickTrader platform to explore technical analysis tools and charts.
It's important to note that triple candlestick formations should be used in conjunction with other technical analysis tools and indicators to confirm a trend continuation or reversal and should also be considered in relation to broader market conditions.
Final Thoughts
Most traders take candlestick analysis into consideration when making trading decisions. They use candle patterns for forex trading, trading on stock, ETF, commodity, and cryptocurrency* markets, as the formation can indicate the future movement of the current trend. Some traders may use a single formation, while others may use a combination of them to make trades in the forex market.
You can open a live trading account at FXOpen to examine charts and trade in the Foreign Exchange market.
*At FXOpen UK, Cryptocurrency CFDs are only available for trading by those clients categorised as Professional clients under FCA Rules. They are not available for trading by Retail clients.
This article represents the opinion of the Companies operating under the FXOpen brand only. It is not to be construed as an offer, solicitation, or recommendation with respect to products and services provided by the Companies operating under the FXOpen brand, nor is it to be considered financial advice.
Stay ahead of the market!
Subscribe now to our mailing list and receive the latest market news and insights delivered directly to your inbox.


Latest articles

DAX 40: consolidation amid technology sell-off
A wave of selling in the technology sector that emerged earlier this week has weighed on European equities. The trigger was investor concern over the profitability of large-scale debt-funded investments by major US tech companies in AI infrastructure. The Nasdaq

Euro Hits Fresh Yearly Lows Amid Dovish ECB Signals
The euro remains under pressure following weak macroeconomic data from the euro area and fresh signals that the European Central Bank is prepared to maintain a more accommodative monetary policy stance. Data released yesterday pointed to a deterioration in business

Pound at Key Levels: Markets Assess Impact of Political Uncertainty in the UK
The British pound remains under pressure following increased political uncertainty in the United Kingdom triggered by the Prime Minister’s resignation. Investors are assessing potential shifts in the political and economic policy outlook after the head of government stepped down,