


Using Ichimoku to Buy and Sell Forex
FXOpen
The Ichimoku indicator belongs to the Japanese technical analysis approach. Embraced by traders all over the world, it is a powerful tool to both trend trading and finding support and resistance levels.
Ichimoku is listed by most trading platforms as a trend indicator, even though it is far more than that. If anything, it is one of the most complete indicators ever created.
Its central part is the cloud, or Kumo, as the Japanese say. For this reason, many refer to trading with the Ichimoku cloud as trading with the cloud.
The cloud is the area between two moving averages: Senkou A and Senkou B. When Senkou A crosses above Senkou B, the cloud is bullish and will prove to be solid support on any future dips. Consequently, a bearish cloud has the Senkou A below Senkou B, and traders will sell potential spikes into it.
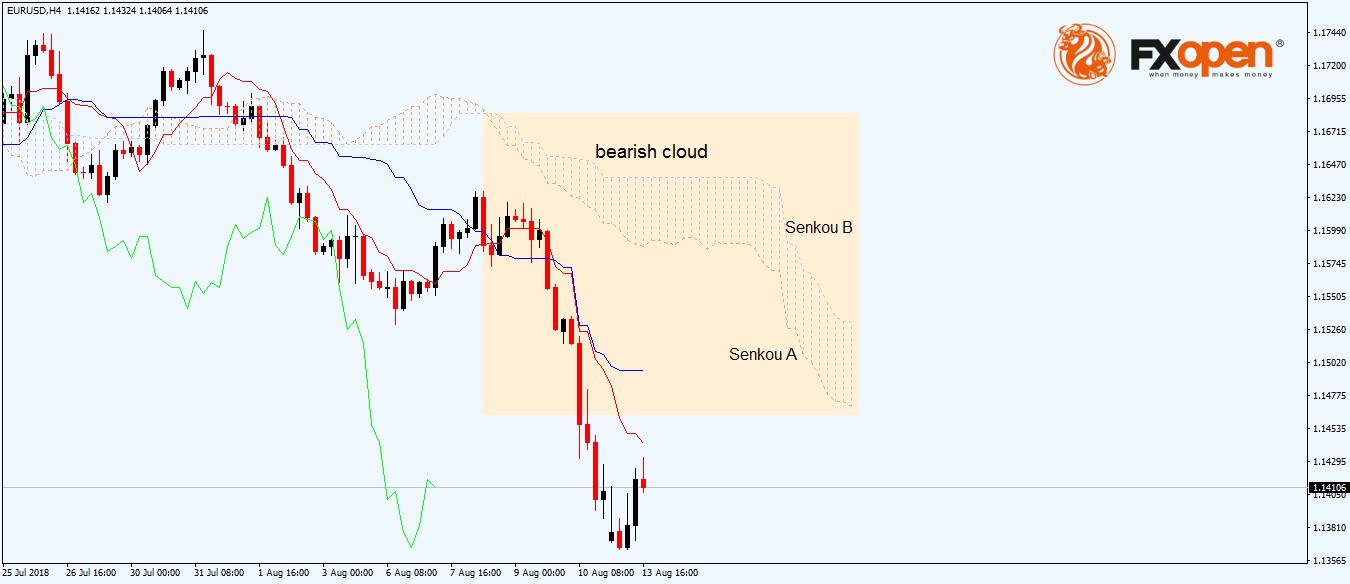
The thicker the cloud is, the stronger the support or resistance provided. Its most important characteristic, though, is that the Ichimoku indicator projects the cloud further in time.
More precisely, the indicator projects the Kumo twenty-six periods ahead. For this reason, traders know exactly where the price will reach the dynamic support or resistance.
Look for the price to react the first time when it reaches the cloud. The more the price is able to reach the cloud, the weaker the support or resistance level becomes.
Trading the Kinjun/Tenkan Cross
The blue and red lines in the chart above are called the Kinjun and Tenkan lines. They are another trending component of the Ichimoku indicator, showing the direction of the underlying trend.
When using them, traders interpret the overall stance of the indicator, not only one element. Hence, in a bearish cloud, traders wait for the Tenkan (the fastest average) to cross below the Kinjun line.
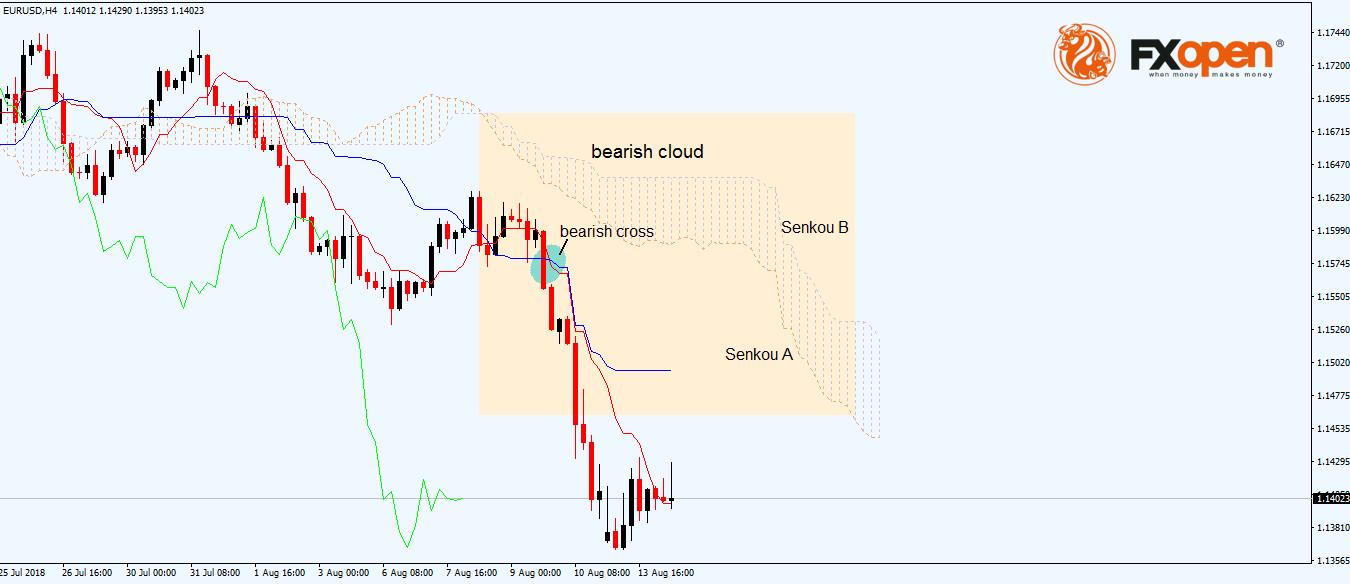
The Kinjun/Tenkan cross, therefore, is used as a signal to buy or sell depending on the Kumo’s nature. A bearish cloud like the one above means that traders will go short on a bearish Kinjun/Tenkan cross.
As any trade needs a stop-loss and a take profit, the previous swing is the natural stop-loss area. For the take-profit, traders use a risk-reward ratio appropriate for the currency market, of minimum 1:2 and target values bigger than 1:3.
How to Use the Chinkou Line
Perhaps the most exciting element part of the Ichimoku Kinko Hyo indicator is the Chinkou line. The green line, it shows the current price’s place in the past.
It sounds complicated and for a good reason. The Ichimoku is the only indicator that shows a state of market equilibrium.
More precisely, the indicator shifts the cloud forward twenty-six periods from the current price but also shows the current price’s projection twenty-six periods back in time. This is what the Chinkou shows, and its role is to avoid the “obstacles” in front of it. Or, previous prices.
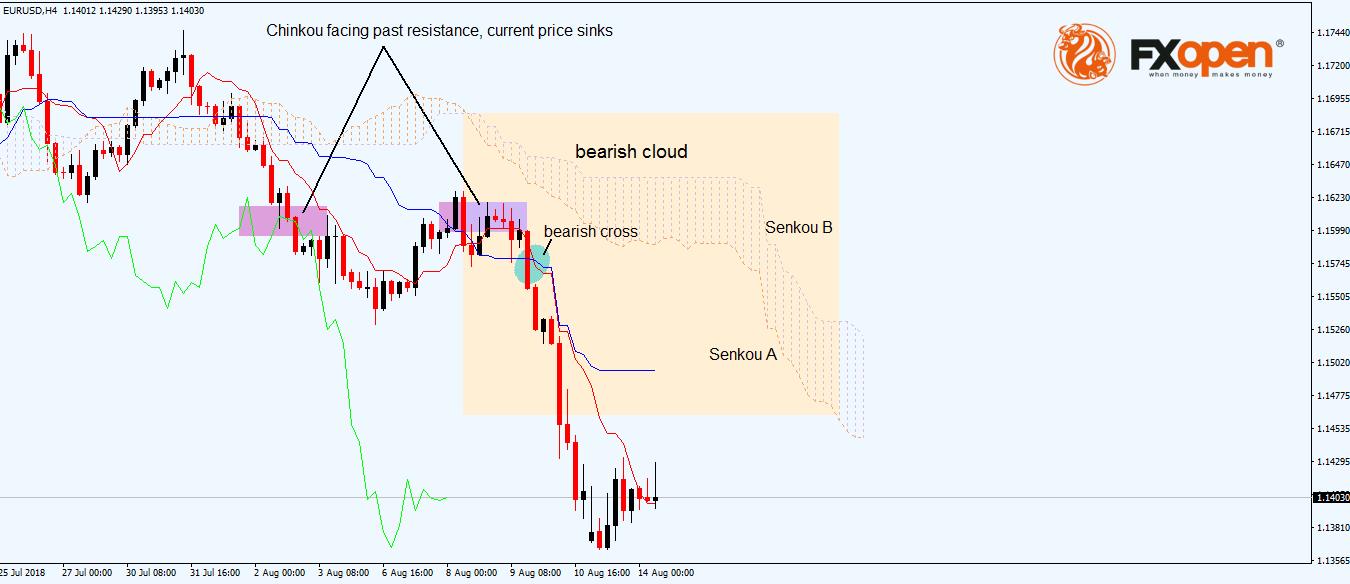
Have a look at the chart above. When Chinkou (the green line) gets closer to the candles, the actual price is twenty-six periods ahead.
More exactly, the two rectangular shapes show where Chinkou (on the left) and actual price (on the right) are. Hence, when Chinkou reaches the past candles, it has the tendency to avoid them. That’s a great place to enter short on the current price.
Conclusion
A wonderful indicator, the Ichimoku Kynko Hyo has no rival in technical analysis. Because it combines past, present and future prices, it gives an overall idea about what a currency pair does.
This article represents the opinion of the Companies operating under the FXOpen brand only. It is not to be construed as an offer, solicitation, or recommendation with respect to products and services provided by the Companies operating under the FXOpen brand, nor is it to be considered financial advice.
Stay ahead of the market!
Subscribe now to our mailing list and receive the latest market news and insights delivered directly to your inbox.

Latest articles

WTI Analysis: Gap Breaks Short-Term Trend as Price Remains Trapped Between the POC and Profile Boundary
WTI crude oil plunged by more than 7% on 27 July 2026 after the US suspended a series of strikes against Iran over the weekend, raising hopes of a diplomatic solution and the reopening of shipping through the Strait of

US Dollar Index: A Defining Week for the King of the Markets
The dollar heads into a pivotal week trading near 101.80, just off a 15-month high, with the Fed's July 29 meeting standing as the clear focal point. Markets currently price roughly a 65% chance of a hold, though renewed

NZD/USD: Inflation Surge Meets Strong US Dollar Pressure
On 21 July, Stats NZ reported an acceleration in inflation: the Consumer Price Index rose 1.5% in the second quarter, while the annual inflation rate climbed to 4.1%, its highest level in more than two years and slightly