


FXOpen

Candlestick patterns are a vital tool for traders, offering insights into market sentiment and potential price movements. Among these formations, breakaway patterns are particularly notable for their ability to signal trend reversals. This article delves into the specifics of these formations, explaining how to identify, interpret, and apply them in trading strategies to potentially enhance trading outcomes.
Understanding Bullish and Bearish Breakaway Candlestick Patterns

Bullish and bearish breakaway candlestick patterns are essential indicators used by traders to identify potential trend reversals. These patterns consist of five specific candlesticks and offer insights into the market's shifting dynamics.
Bullish Breakaway Pattern
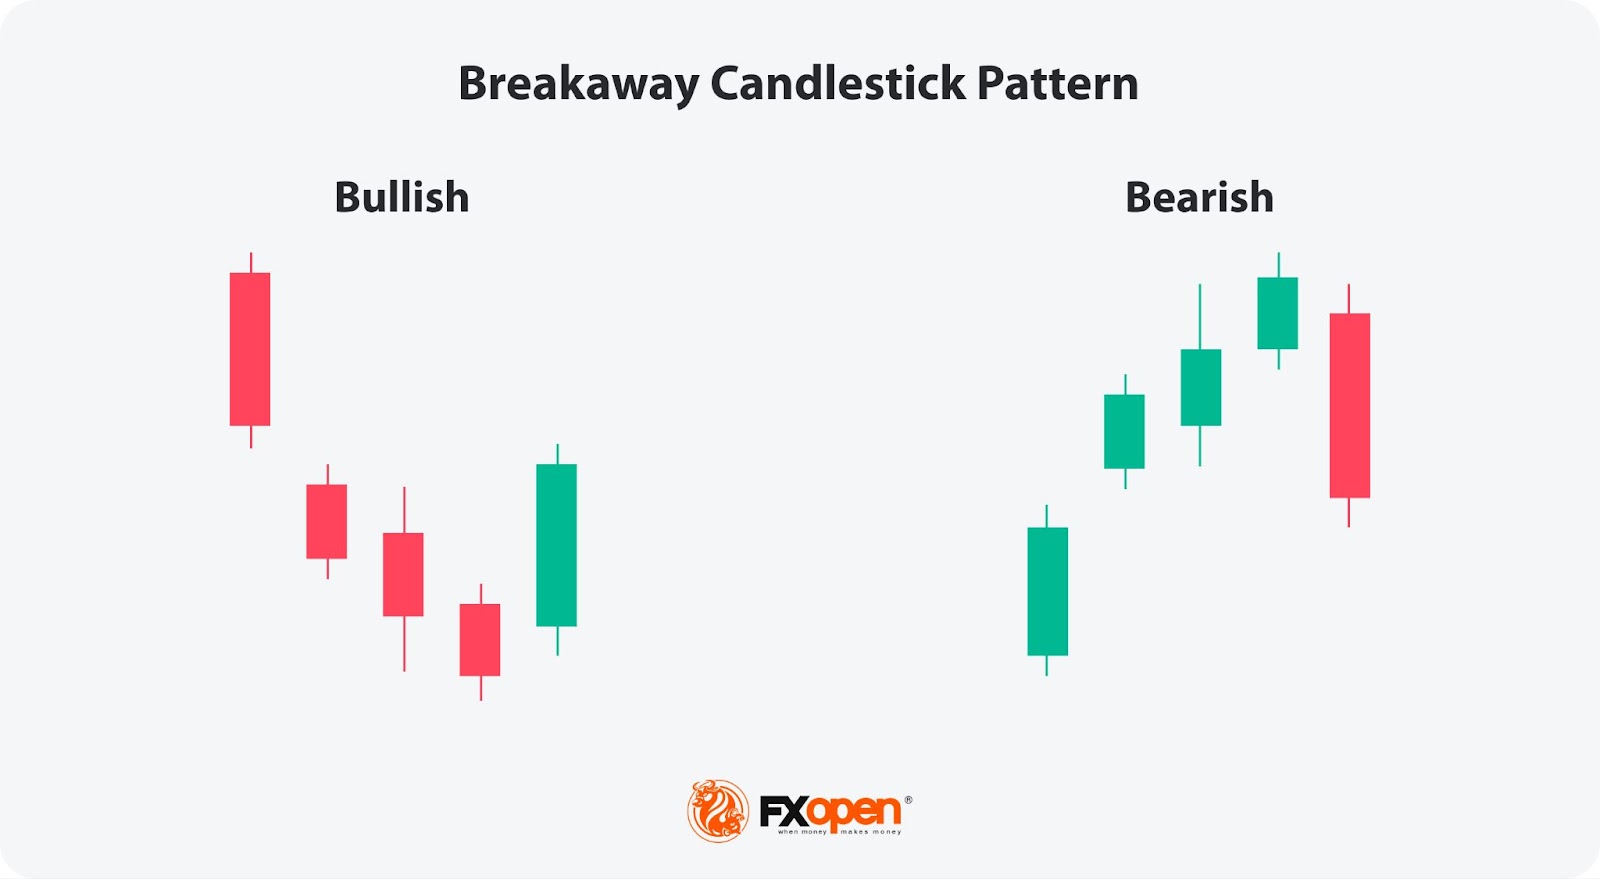
A bullish breakaway signals the potential end of a downtrend and the beginning of an uptrend. It comprises five candlesticks:
- First: A large bearish candle, indicating strong selling pressure.
- Second: A smaller bearish candle, showing a continuation of the downtrend but with reduced intensity. There is also a gap.
- Third: Another bearish/bullish candlestick, typically smaller than the second, suggesting further weakening of the downtrend.
- Fourth: A smaller bearish candle, hinting at a possible reversal.
- Fifth: A large bullish candle that closes within the gap between the first and the second candles. The signal is stronger if the candle closes above the high of the first candle.
Bearish Breakaway Pattern
A bearish breakaway indicates the potential end of an uptrend and the beginning of a downtrend. It also consists of five candlesticks:
- First: A large bullish candle, showing strong buying pressure.
- Second: A smaller bullish candle with a gap up, indicating a continuation of the uptrend but with decreased momentum.
- Third: Another bullish/bearish candle, typically smaller than the second, suggesting further weakening of the uptrend.
- Fourth: A small compressed bullish candle, signalling a possible reversal.
- Fifth: A large bearish candle that closes within the gap between the first and the second candles. The signal is stronger if it breaks below the low of the first candlestick.
Criteria for Identifying Breakaway Patterns
When identifying breakaway patterns, traders look for specific criteria:
- Trend Context: Both formations occur after a defined trend—a bullish breakaway after a downtrend and a bearish breakaway after an uptrend.
- Candle Sizes: The first candle is always the largest, showing strong market sentiment in the trend’s direction. The subsequent candles typically decrease in size, indicating a weakening trend.
- Confirmation Candle: The fifth candle is crucial as it confirms the reversal. It must close within the gap between the first and the second candlesticks.
These patterns are valuable for traders as they provide early signals of potential trend changes, allowing for more strategic planning and analysis.
To get started spotting your own patterns, head over to FXOpen’s free TickTrader platform to explore real-time forex, stock, and cryptocurrency* charts.
Caveats to the Pattern
While these rules represent the ideal breakaway formation, there can be some flexibility. For instance:
- Candle Sizes: The first candle should be the largest and the next three smaller. However, the middle three don’t necessarily need to be consecutively smaller, just smaller than the first.
- Transition Candle: If the fourth candle shifts colour (bullish for bullish breakaway, bearish for bearish breakaway), this can add confirmation that a potential reversal is underway.
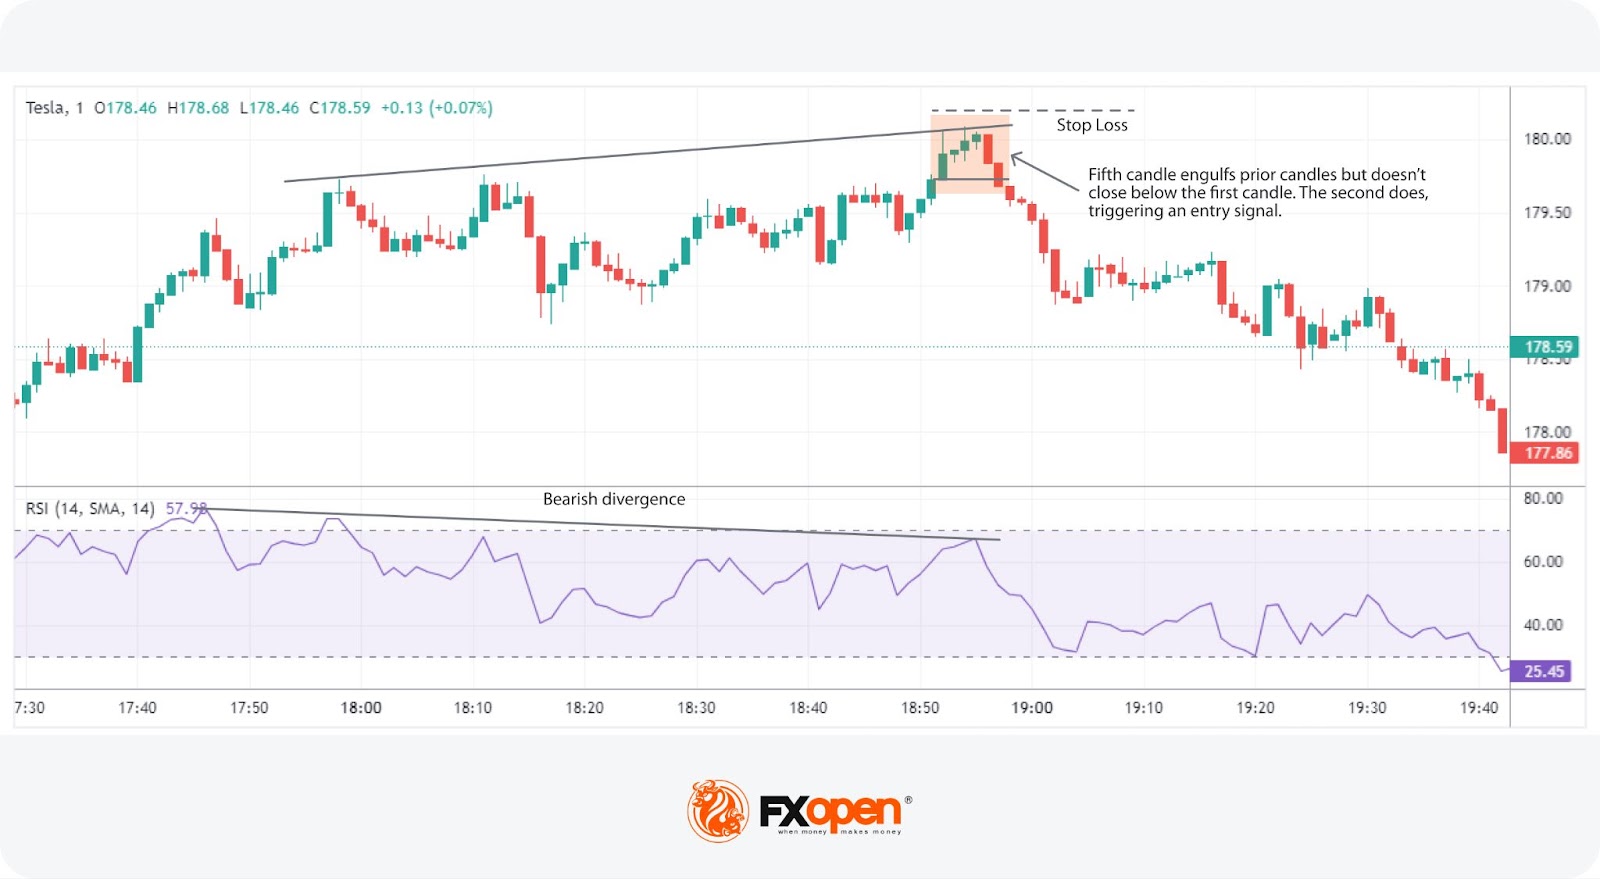
- Closing Beyond the First Candle: While the fifth candle closing beyond the first is preferable, it’s also acceptable if the following (sixth) candlestick is the one that closes below the first. The idea is that the final movement of the formation engulfs the prior candlesticks, signalling a reversal.
- Gaps: A gap between the first and second candle indicates momentum before the subsequent reversal, implying that the reversal may have more strength behind it as traders buying the top/selling the bottom exit their positions. Gaps may be visible on daily charts (especially in stocks) but not on intraday charts or in more liquid assets, meaning they are not essential.
Interpreting the Breakaway Pattern
Interpreting breakaway patterns provides traders with valuable insights into potential market reversals. These formations indicate a shift in market sentiment and offer signals for possible trend changes.
Inferences from Breakaway Patterns
- Shift in Momentum: A bullish breakaway candlestick pattern suggests that bearish momentum is weakening, and buyers are gaining control. Conversely, a bearish breakaway indicates that bullish momentum is fading and sellers are taking over.
- Market Sentiment: The appearance of the final large candlestick signifies a strong sentiment shift. In bullish formations, it shows increasing buyer confidence, while in bearish formations, it highlights growing seller dominance.
- Potential Entry and Exit Points: Traders often use these formations to identify potential areas for entries, aligning with broader market analysis and risk management plans.
Key Considerations
- Context Matters: Breakaways are more reliable when they occur after a well-established trend. Identifying the prevailing trend's strength and duration may enhance their validity.
- False Signals: Not all breakaway patterns result in significant reversals. Market conditions, news events, and broader economic factors can influence outcomes, so it's crucial to consider these elements.
- Confirmation: Waiting for the fifth candle to complete is essential. Premature conclusions based on incomplete patterns can lead to inaccurate interpretations.
Applying the Breakaway Pattern in Trading Strategies
Incorporating the breakaway pattern into trading strategies involves looking for additional confluence, using momentum indicators, and employing sound risk management practices.
Additional Confluence
Traders look for other factors to confirm the validity of the pattern:
- Shift in Fundamentals: A significant news event or change in economic conditions can support its signal.
- Support and Resistance Levels: The pattern may be more reliable if it occurs near key support or resistance levels, indicating a stronger potential reversal.
- Volume Analysis: Increased trading volume during the subsequent reversal adds credibility.
Using Momentum Indicators
Momentum indicators can provide further confirmation:
- Average Directional Index (ADX): ADX is commonly used to identify the strength of the trend. Low numbers coinciding with the pattern strengthen the signal of a trend change.
- Commodity Channel Index (CCI): As the breakaway formation often appears at the end of a trend, CCI might show that the price is overbought (bearish breakaway) or oversold (bullish breakaway), supporting the reversal.
- Momentum: Divergences between price action and the indicator can be powerful confirmation tools, indicating a potential reversal.
Entries and Risk Management
Traders typically enter a trade once the price closes beyond the high (bullish) or low (bearish) of the first candle in the pattern. Some traders might wait for an additional candle to confirm the reversal.
Stop Losses
Placing stop losses just beyond the high (for bearish) or low (for bullish) of the formation helps potentially manage risk.
Profit Targets
Profit targets might be set using several methods:
- Risk/Reward Ratio: At a favourable ratio, such as 2:1 or 3:1.
- Support and Resistance Levels: Targeting the next significant support or resistance area where a reversal might occur.
- Technical Indicators: Exiting based on signals from indicators, such as RSI crossing into the overbought territory after a bullish entry.
The Bottom Line
Understanding and applying breakaway patterns can potentially enhance trading strategies by providing early signals of trend reversals. For traders looking to implement these techniques, opening an FXOpen account offers a robust platform to explore this and other advanced trading strategies.
FAQs
What Is the Bullish and Bearish Breakaway Pattern?
The bullish and bearish breakaway patterns are five-candle formations in technical analysis that signal potential trend reversals. A bullish breakaway occurs at the end of a downtrend and indicates a possible shift to an upward trend, characterised by a sequence of weakening bearish candles followed by strong bullish ones. Conversely, a bearish breakaway appears at the end of an uptrend, suggesting a shift to a downward trend, marked by diminishing bullish candles followed by decisive bearish ones.
What Is the Bullish Reversal Candlestick Pattern?
It is a formation in technical analysis that signals a potential shift from a downtrend to an uptrend. It typically occurs at the bottom of a downtrend and is characterised by single or multiple candlesticks indicating that buying pressure is increasing, suggesting that the asset's price may start to rise. Common examples include the hammer, bullish engulfing, and morning star patterns.
What Is the Bearish to Bullish Reversal?
The bearish to bullish reversal is a shift in market sentiment where the trend changes from downward to upward. This indicates that selling pressure is decreasing and buying pressure is increasing, suggesting a potential rise in the asset's price. This reversal can be identified through various technical analysis tools that signal the end of a downtrend and the beginning of an uptrend.
*At FXOpen UK and FXOpen AU, Cryptocurrency CFDs are only available for trading by those clients categorised as Professional clients under FCA Rules and Professional clients under ASIC Rules, respectively. They are not available for trading by Retail clients.
This article represents the opinion of the Companies operating under the FXOpen brand only. It is not to be construed as an offer, solicitation, or recommendation with respect to products and services provided by the Companies operating under the FXOpen brand, nor is it to be considered financial advice.
Stay ahead of the market!
Subscribe now to our mailing list and receive the latest market news and insights delivered directly to your inbox.


Latest articles


Market Insights with Gary Thomson: Oil, US Retail Sales & NFP in Focus
In this video, we’ll explore the key economic events and market trends, shaping the financial landscape. Get ready for insights into financial markets to help you navigate the week ahead. Let’s dive in!
In this episode of Market

Geopolitics Fuels Volatility: AUD/USD and USD/CAD Near Key Levels
Commodity-linked currencies continue to weaken amid rising geopolitical tensions, which are boosting demand for safe-haven assets and increasing volatility across both FX and commodity markets. The US dollar is gaining support from demand for liquid and defensive assets, while currencies