


What Are Price Trend Indicators? Definition and Meaning
FXOpen
Price trend indicators are technical analysis tools used to identify and assess the direction and strength of trends in financial markets. These indicators analyse historical price data to provide insights into the current market sentiment and future price movements. This FXOpen article highlights all the best trending indicators and explains with TickTrader charts how traders may use them in trading.
Moving Averages
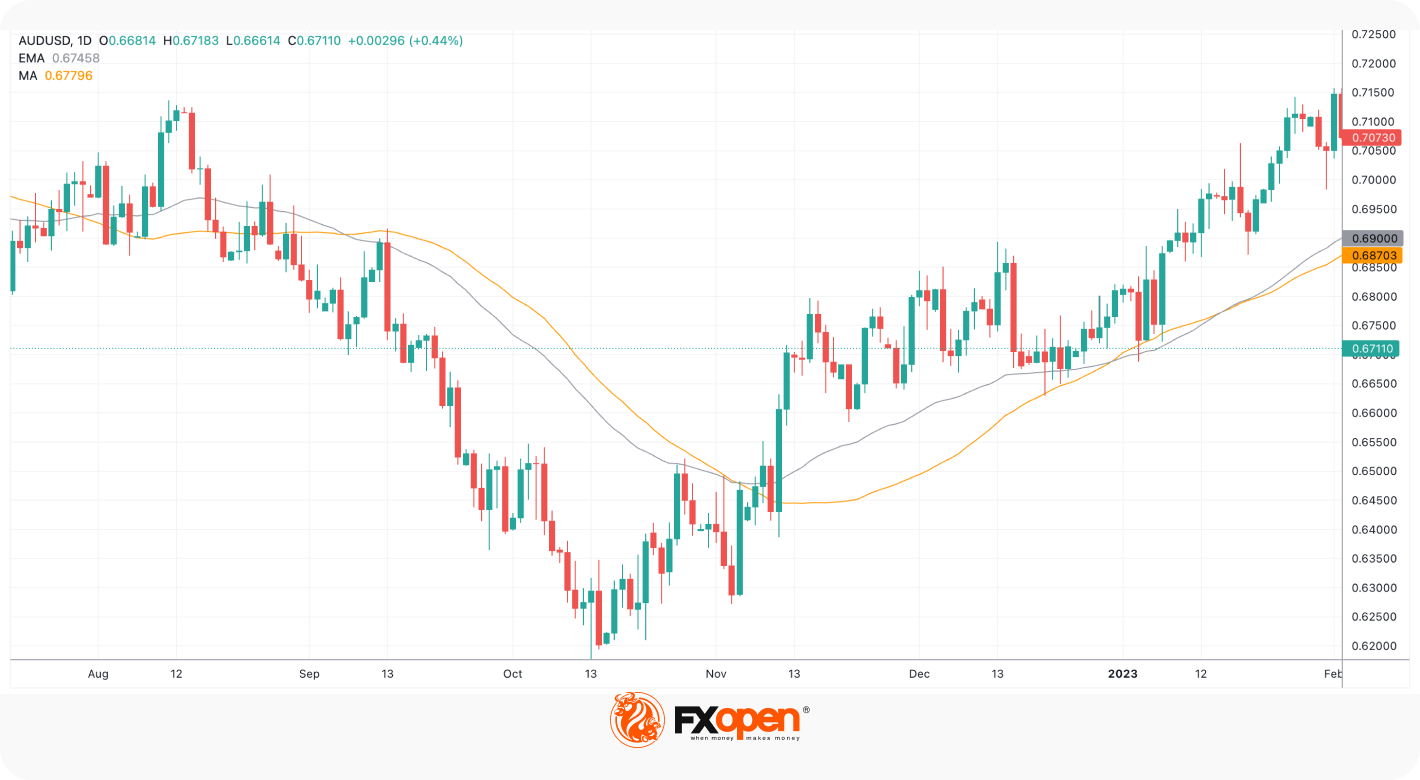
Moving averages (MAs) come first in the trend indicators list. These are widely used technical tools in financial analysis that calculate the average price of a security over a specified period. The simple moving average (SMA) and the exponential moving average (EMA) are the most common MAs in price action trading.
SMA computes the mean price by summing the prices over a particular number of periods and then dividing the result by the number of prices used in the calculation. EMA, on the other hand, gives more weight to recent prices, resulting in a more responsive moving average.
These are some of the best stock price trend indicators. However, MAs can be used when trading other financial instruments.
Here is how traders usually interpret and use MAs on price action charts:
- Moving averages may help traders and analysts identify trends and their potential reversals. The MA follows the price, so a rising moving average reflects a bullish trend, while a falling average stands for a bearish trend. When the moving average changes its direction, the trend is expected to reverse.
- Traders use moving averages to enter and exit markets. For example, when the shorter-term moving average crosses above the longer-term moving average, it may signal a bullish bias and prompt traders to enter a long position. Conversely, the shorter-term moving average crossing below the longer-term moving average might indicate a bearish bias, prompting traders to consider selling the security.
- Moving averages may also be utilised as support and resistance lines. In an uptrend, the moving average can serve as a dynamic support line, while in a downtrend, it can act as resistance.
Trendlines
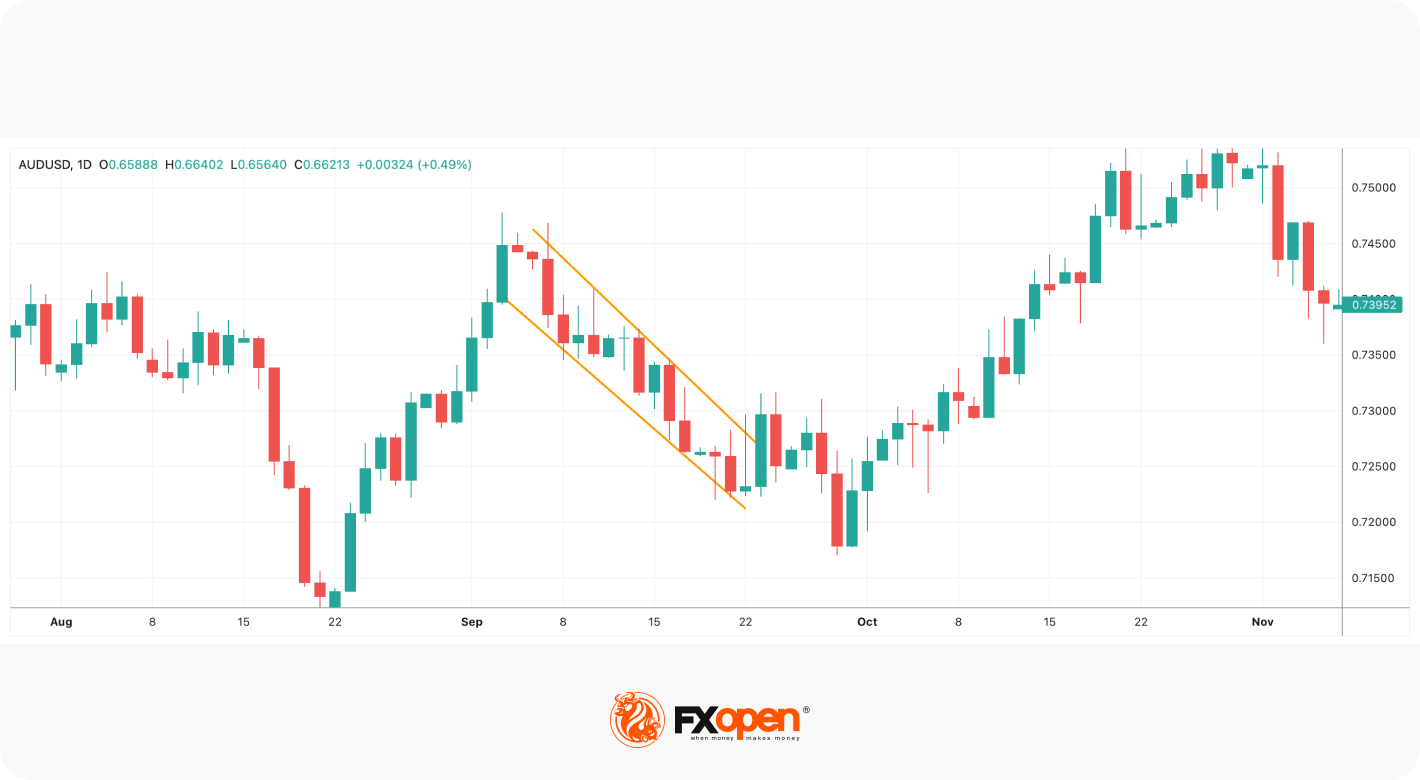
Trendlines are graphical tools used in technical analysis to identify and analyse the direction of a security's trend. A trendline is drawn by connecting two or more significant price points, such as peaks or troughs, on a chart. The resulting line visually represents the trend and can provide insights into potential support and resistance levels.
Here is the general interpretation and usage of trend lines:
- Trend lines are primarily used to identify the prevailing market trend. An upward line drawn through higher lows and highs indicates an overall bullish bias. Conversely, a downward trendline drawn by connecting lower highs and lows suggests a bearish bias. Traders and analysts use these to make decisions about buying, selling, or holding securities.
- Trend lines also serve as support or resistance levels. An upper line that connects highs acts as a resistance level, while a lower line that connects lows serves as a support. Using trendline, traders can trade in up and downtrends.
- Another use case is breakout trading. Breakouts above or below a trendline can indicate potential trend reversals or the continuation of an existing movement, providing opportunities for traders to enter or exit positions.
Average Directional Index (ADX)
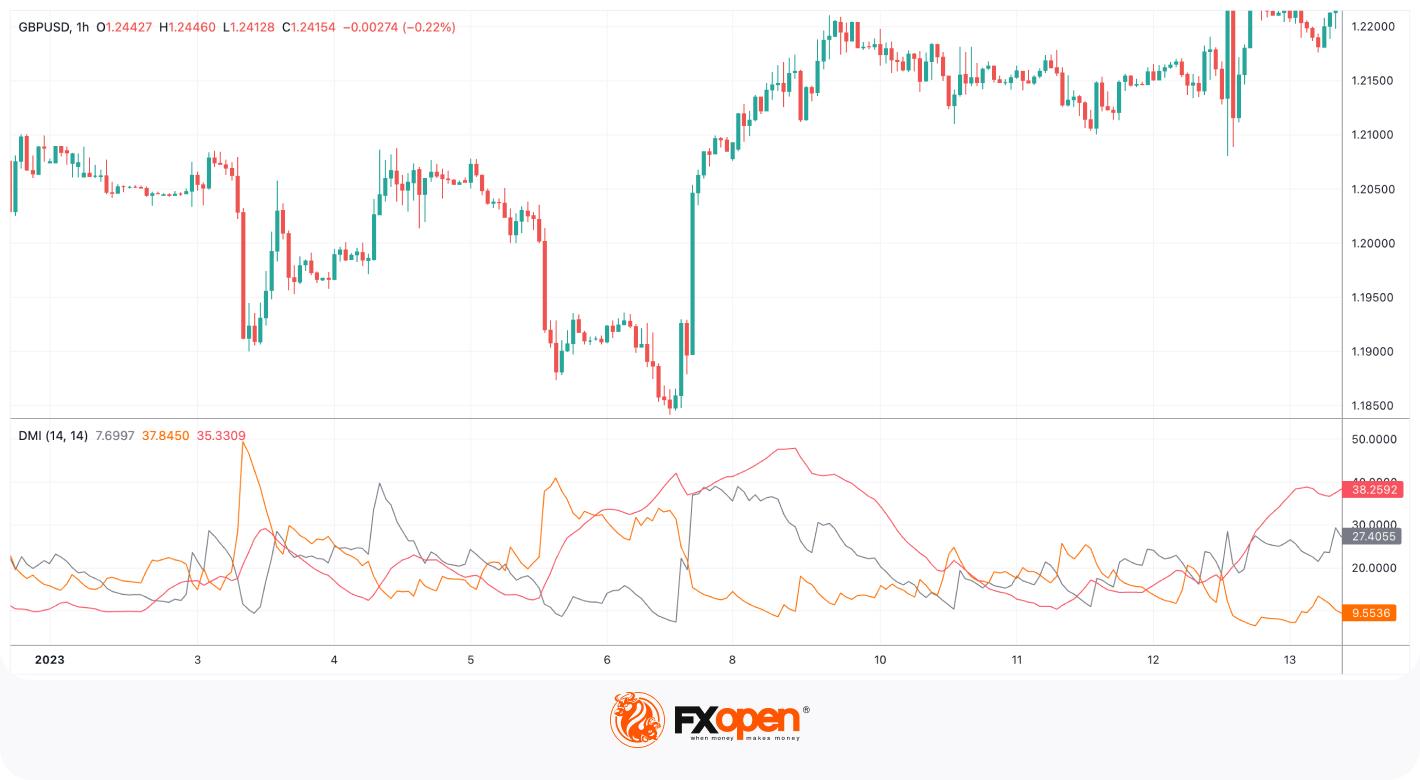
The Average Directional Index (ADX) is a technical indicator that measures the strength and momentum of a trend. Developed by J. Welles Wilder, the ADX is derived from the Directional Movement System and consists of three lines: the ADX line itself, along with the positive directional indicator (+DI) and the negative directional indicator (-DI).
Traders may interpret and use it as follows:
- The ADX is used to determine the strength of a trend, whether it is an uptrend or a downtrend. The ADX line typically ranges from 0 to 100, with higher values indicating a stronger trend. Traders look for ADX values above 25 to identify a trend with sufficient strength to potentially generate profitable trading opportunities. Readings below 25 signal a weak trend.
- In addition to measuring trend strength, the ADX also helps traders identify whether a market is trending or consolidating. When the ADX is rising, it suggests the presence of a trend, while a declining ADX may indicate a range-bound or consolidating market. Traders often combine the ADX with other indicators or chart patterns to make trading decisions.
- The +DI and -DI lines, which accompany the ADX, provide information about the direction of the trend. When the +DI line is above the -DI line, it indicates a bullish bias, and when the -DI line is above the +DI line, it suggests a bearish bias.
Parabolic SAR
The Parabolic SAR is used to identify potential price reversals in an instrument. It was developed by J. Welles Wilder and is represented by a series of dots that appear above or below the price on a chart.
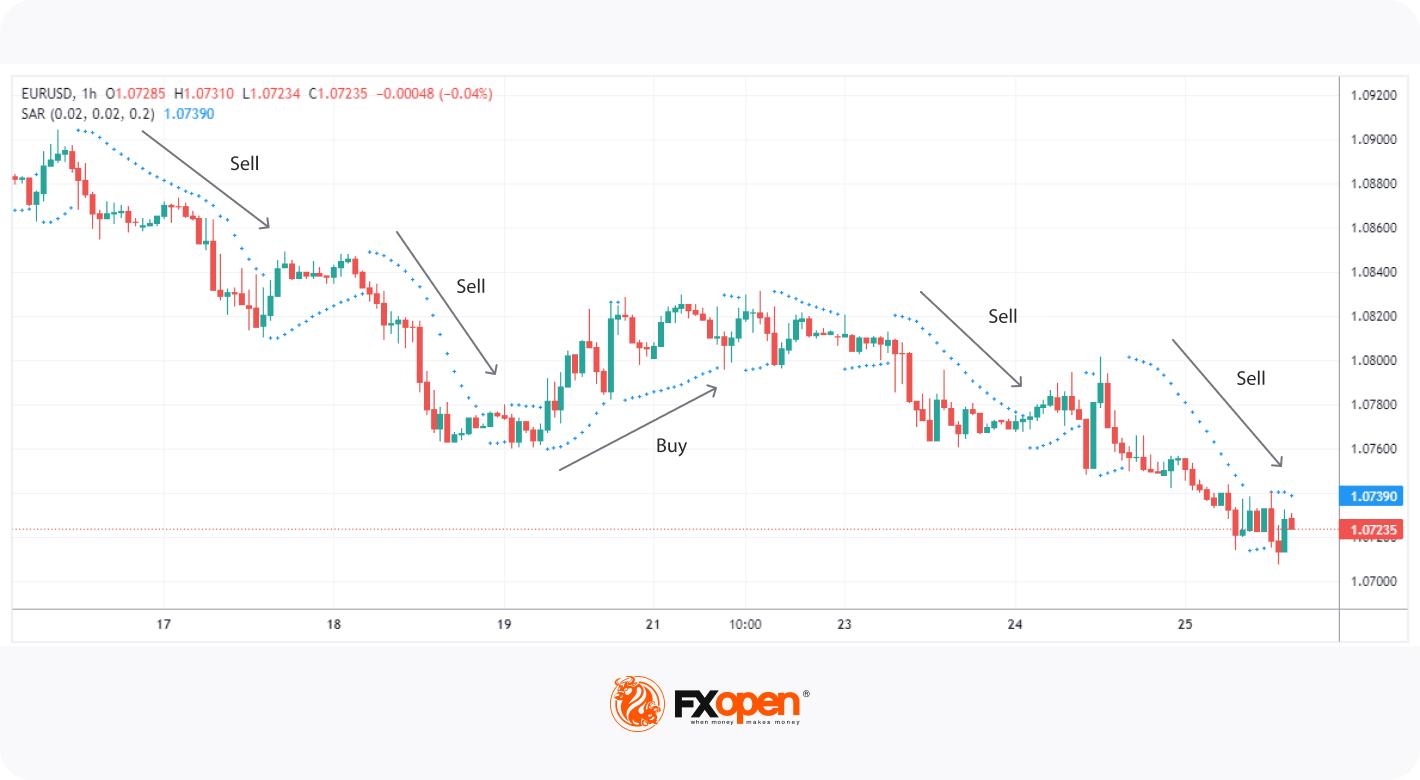
Market participants may identify and implement it as follows:
- The Parabolic SAR is primarily used to identify trends and their reversals. If the dots are below the price, it’s a sign of an upward movement. Conversely, when they are above the price, the market is falling. According to the theory, there should be at least three dots to avoid false signals.
- Another way to use the Parabolic SAR is to set trailing stop-loss levels. As the dots are located below the price in an uptrend and above the price in a downtrend, a trader can trail the stop-loss level to the indicator’s dots.
Ichimoku Cloud
The Ichimoku Cloud, also known as Ichimoku Kinko Hyo, is one of the best price action indicators that provide a holistic view of a security's trend, support and resistance levels, and potential future movements. It was developed by Goichi Hosoda, a Japanese journalist, in the late 1930s.
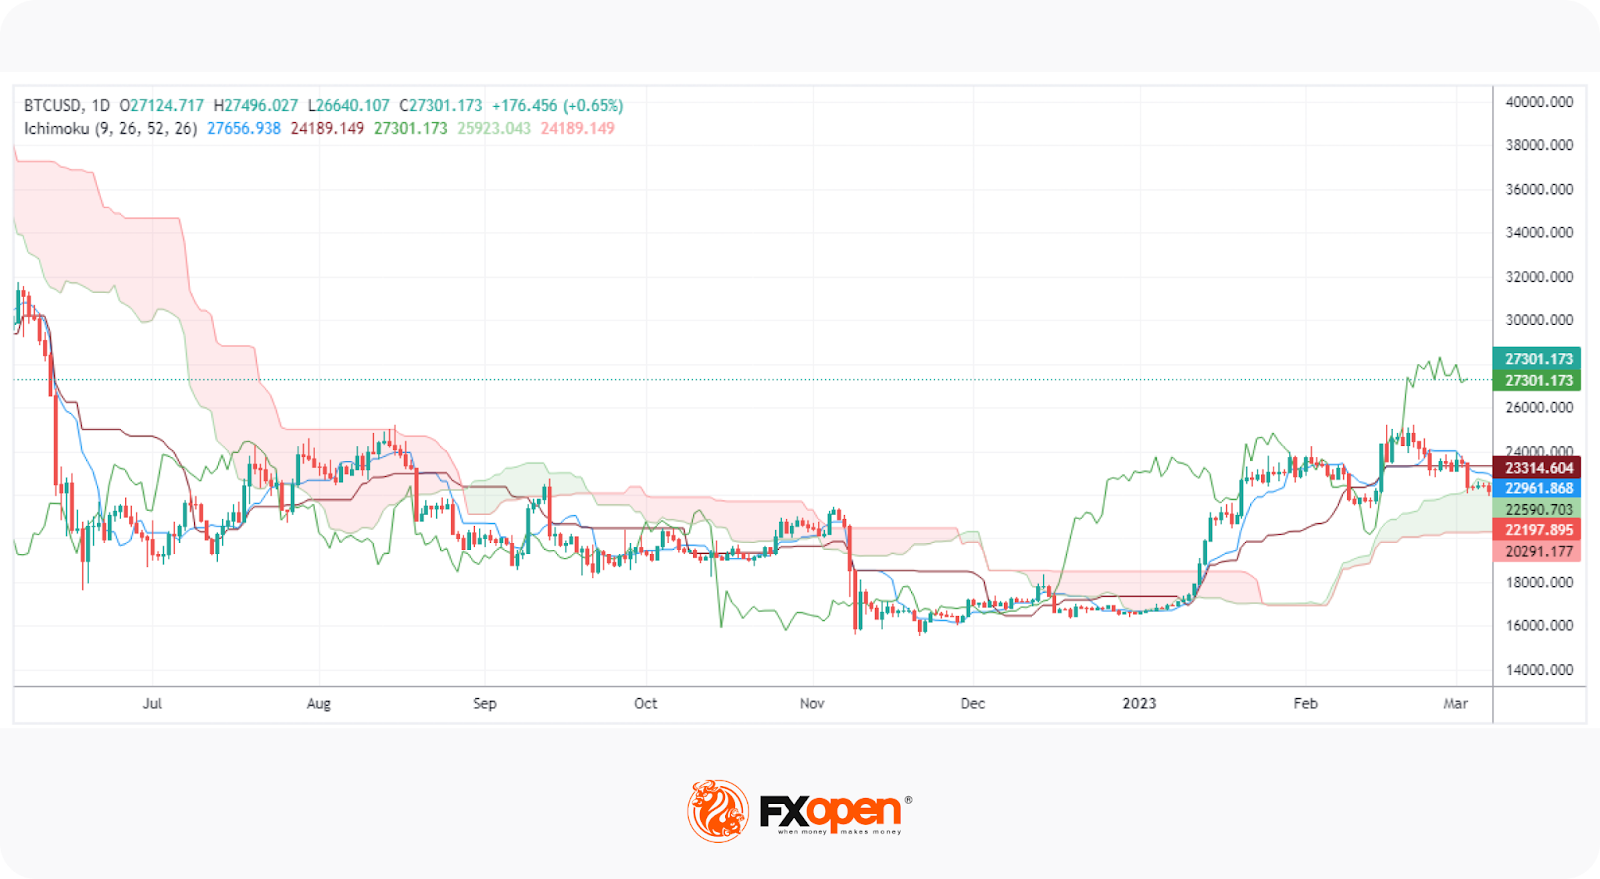
The indicator may be interpreted as follows:
- The Ichimoku Cloud consists of several components, the most prominent of which is the "cloud" or "Kumo." The cloud is formed by two lines, the Senkou Span A and Senkou Span B, and is coloured red and green to distinguish between bullish and bearish market conditions. The cloud represents an area of support or resistance and helps traders identify potential trend reversals or continuation patterns. When the price is above the cloud, it suggests a bullish bias, and when it is below the cloud, it indicates a bearish bias.
- In addition to the cloud, the Ichimoku Cloud system includes other components such as the Tenkan-sen (Conversion Line), Kijun-sen (Base Line), and Chikou Span (Lagging Span). The Tenkan-sen and Kijun-sen lines may act as dynamic support and resistance levels and can provide trading signals when they cross or when they intersect with the price. The Chikou Span represents the current closing price, plotted backwards on the chart, and can be used to confirm signals or identify potential support and resistance levels.
Traders use the Ichimoku Cloud to assess the overall market movement, identify potential entry and exit points, and manage risk.
Conclusion
These technical analysis tools are not standalone indicators but are often used in combination with other tools and analysis techniques. Traders and analysts rely on them to make informed trading decisions, manage risk, and identify potential entry and exit points in the market.
However, it's essential to understand that no single indicator guarantees accurate predictions, and it's always advisable to use a holistic approach, combining multiple tools and considering fundamental analysis and market conditions. As you develop a good understanding of these systems, you may open an FXOpen account and trade with low spreads on various financial instruments.
This article represents the opinion of the Companies operating under the FXOpen brand only. It is not to be construed as an offer, solicitation, or recommendation with respect to products and services provided by the Companies operating under the FXOpen brand, nor is it to be considered financial advice.
Stay ahead of the market!
Subscribe now to our mailing list and receive the latest market news and insights delivered directly to your inbox.


Latest articles

Ripple: Letter to Congress Stirs the Crypto Market
At the beginning of June, more than 200 crypto companies and industry groups — including Coinbase, Andreessen Horowitz and Ripple Labs — sent a letter to Senate Majority and Minority Leaders John Thune and Chuck Schumer, urging them to bring the Digital

GBP/JPY: Ascending Triangle Under Pressure
The GBP/JPY pair has come under pressure after the Bank of Japan raised its policy rate to 1.0% on 16 June. The Bank of England is following the opposite path: at its 30 April meeting, the Monetary Policy

Pound Under Pressure: Markets Await Bank of England And SNB Decisions
The British pound remains under pressure following weaker-than-expected inflation data, which has reinforced expectations of further monetary easing by the Bank of England. Investors are staying cautious ahead of today’s policy meetings of both the UK central bank and