


What Does the Inverted Yield Curve Mean to You?
FXOpen
There has been a lot of talk surrounding the recent yield curve inversions in US debt markets. From a simple perspective, an inverted yield curve can be a portent of problems in the markets, and perhaps even a big crash in equities.
It is important to understand what a yield curve is, and why traders and investors pay close attention to it. The recent yield curve inversions do point to rough times ahead in the markets, especially combined with the weak data that has been flowing out of most nations.
There is no way to say for sure that an inverted yield curve will create chaos in the markets, but once you dig a little deeper into what an inverted yield curve can predict, it will be easy to understand why markets are starting to tread with caution.
What is the Yield Curve?
A yield curve is a simple way to look at the debt market. The inverted yield curve that is making headlines is a measure of US government debt. All the maturity dates are represented on the yield curve, from the 3-month bill, all the way to the 30-year bond.
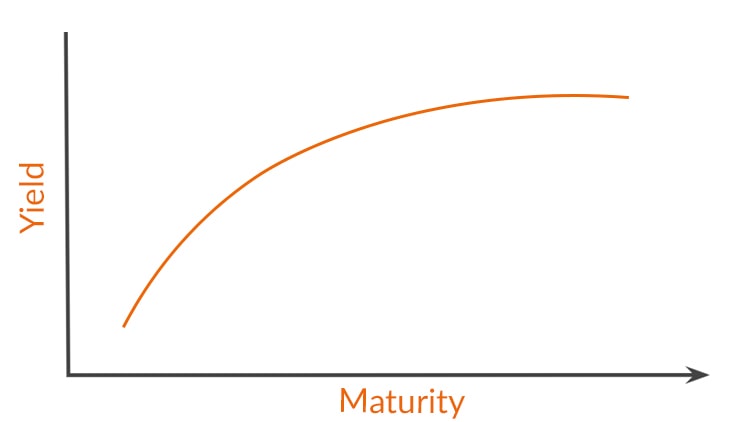
Normally, shorter-dated debt will pay a lower yield than longer-dated bonds. One of the big reasons for this is that inflation is likely to erode gains from interest over time, which makes longer bonds far more sensitive to economic fundamentals.
For example, if there is likely to be higher inflation over the next five years, a 3-month bill wouldn’t be as likely to be impacted by a rise in inflation, but the returns from a 10-year bond would probably get nailed.
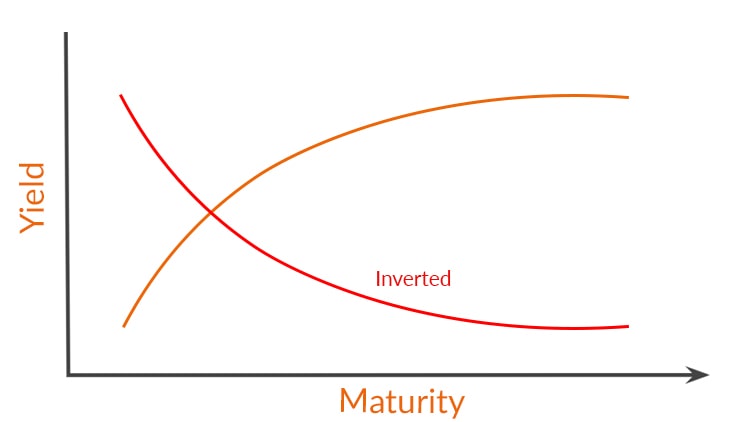
What is an Inverted Yield Curve?
An inverted yield curve describes the state of a yield curve when longer-dated debt actually yields less than shorter-dated obligations. This never really makes sense from a fundamental standpoint, but it has occurred sporadically in the financial markets.
Many economists have ideas about why an inverted yield curve happens. Some say that because a Central Bank has more control over the shorter-dated debt on a yield curve, it is easier for this phenomenon to occur as a result of policy action.
At its most basic level, an inverted yield curve means that the markets are willing to pay a premium for long-dated debt, which often signals much lower rates (and economic weakness) in the medium-term. Some kinds of inverted yield curves have a curious habit of predicting recessions.
Why is it important?
The relationship between 2-year and 10-year US debt obligations is closely watched by traders, as it has been 100% correct in predicting the last 5 US recessions. Like anything in the financial markets, past performance isn’t indicative of the future, but there are reasons to think that a fully inverted yield curve is a harbinger of rough times for the global economy.
What Happens After a Yield Curve Inverts?
As mentioned above, there is no way to know for sure what will happen after a fully inverted yield curve manifests in the US government debt markets.
It is possible to say that in every US recession going back to 1980 (and earlier as well, though not consistently) followed an inverted yield curve. The recession generally happened one or two years after the inversion of the 2-year and 10-year debt obligations.
In 2000 and 2007 it seems to have predicted both a recession and stock market crash, which makes it an ominous event for anyone on the long side of the equity markets. It is easy to see why it could also be seen as a warning of lower central bank lending rates as well, as it has predicted rate-cutting cycles as well.
An inverted yield curve is certainly evidence of soaring demand for long-dated bonds, as substantial market interest has to be present to push long-dated bond prices lower.
A bull market for bonds is another warning sign for risk assets, as it demonstrates that large amounts of capital are flowing to assets that are viewed as a safe haven. None of these factors should be seen as a predictor of things to come, but some amount of caution is warranted in the wake of a yield curve inversion.
Conclusion
An inverted yield curve isn’t a common occurrence in the financial markets, and it has been a reliable predictor of both recessions, and equity market meltdowns.
The most recent inversion takes place when the global economy is showing signs of slowing down. There are a number of factors that should alert investors to possible problems ahead, and the inversion in the 2-year and 10-year yield curve is an important signal of a possible large-scale decline in economic activity.
Debt markets are clearly signaling the expectation of much lower rates in the future, which would imply that the global market could be in for a rough ride.
This article represents the opinion of the Companies operating under the FXOpen brand only. It is not to be construed as an offer, solicitation, or recommendation with respect to products and services provided by the Companies operating under the FXOpen brand, nor is it to be considered financial advice.
Stay ahead of the market!
Subscribe now to our mailing list and receive the latest market news and insights delivered directly to your inbox.

Latest articles

Weekly Market Insights with Gary Thomson: The Week of Central Banks and Earnings
In this video, we’ll explore the key economic events and market trends, shaping the financial landscape. Get ready for insights into financial markets to help you navigate the week ahead. Let’s dive in!
In this episode of Market

Intel at a Crossroads: Earnings Beat Meets Technical Resistance
Intel has just delivered its strongest quarter in over fifteen years, and the market reaction says it all. Q2 2026 revenue surged 25% year-over-year to $16.1 billion, crushing the consensus estimate of $14.42 billion, while adjusted EPS of

Tesla: Complex Range Structure Breaks Down Following Quarterly Earnings
Tesla released its Q2 2026 results after the market closed on 22 July. Revenue increased 26% year-on-year to $28.24 billion, while vehicle deliveries reached a record 480,126 units. However, operating margin fell sharply to 1.4%, down from