FXOpen
Understanding volatility is crucial for creating effective trading strategies. One popular tool used when measuring volatility is the Chaikin Volatility indicator. In this article, we will take an in-depth look at this tool, how it’s calculated, and how to use it when trading.
What Is the Chaikin Volatility Indicator?
The Chaikin Volatility indicator, named after its creator, Marc Chaikin, is a tool used to gauge volatility in financial markets and anticipate potential reversals. Volatility, in its simplest terms, refers to the degree of price fluctuation in an asset over a given period. High volatility is often associated with increased risk but also comes with the potential for greater returns. Conversely, low volatility suggests more stability.
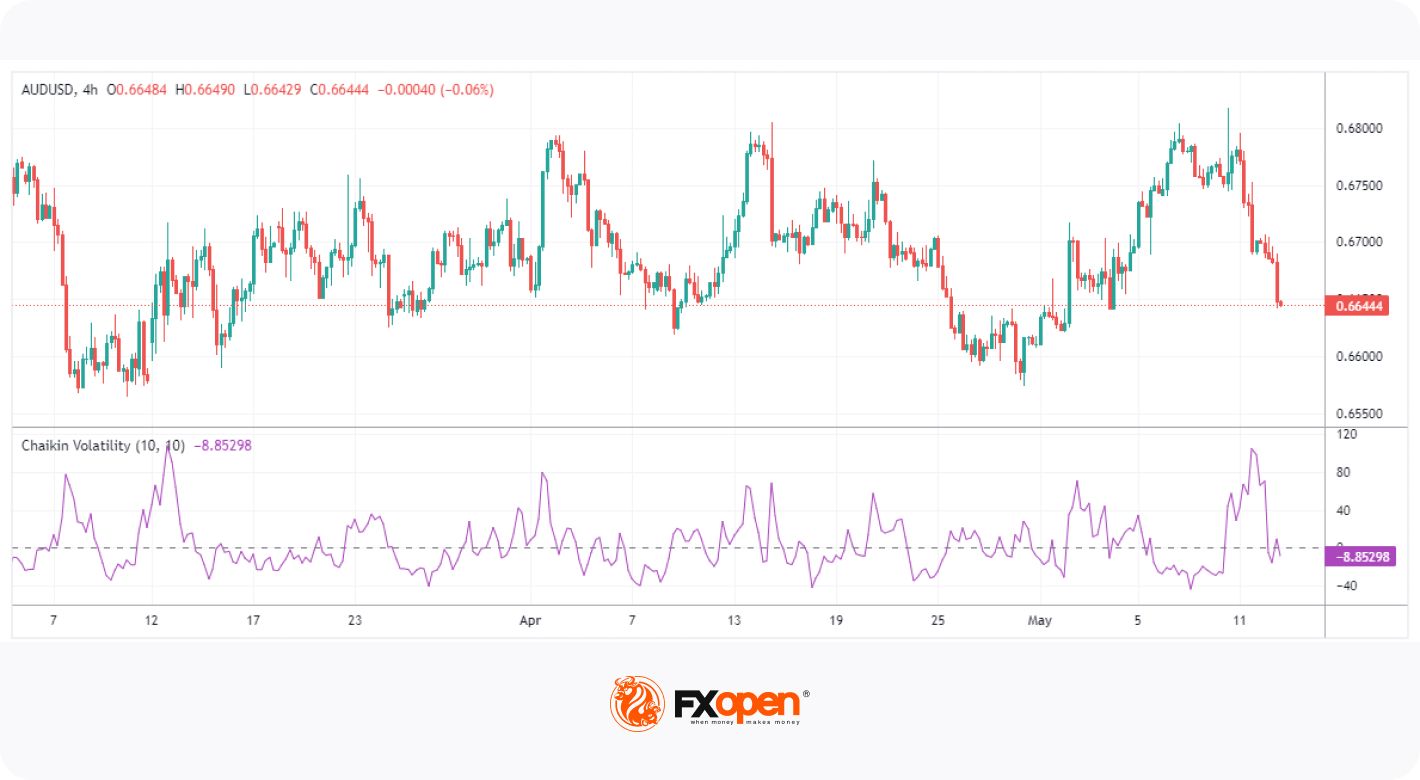
Chaikin Volatility focuses on the trading range, quantifying the difference, or spread, between high and low prices over a specified period, typically 10 candles, and measures the rate at which this range expands or contracts. Unlike other volatility indicators, it doesn’t account for an asset’s direction but rather the momentum of its movements.
When this spread widens, it indicates increasing volatility, accompanied by a sharp spike in the measure’s value. Conversely, a narrowing spread suggests decreased volatility, which results in the value declining.
How Is Chaikin Volatility Calculated?
As with many technical indicators, Chaikin Volatility appears complex at first glance. But, its calculation is relatively straightforward.
The tool is based on the exponential moving average (EMA) of the difference between the high and low prices of a given period. The formula involves a two-step process.
First, calculate an EMA of the difference between the high and low prices over N periods. N is typically 10.
High-to-Low EMA = 10-period EMA of (H-L)
Then, work out the percentage change in the EMA over a further N period, also usually 10.
Chaikin Volatility Value = (Current EMA value - EMA value 10 periods ago) / EMA value 10 periods ago * 100
The result is a value that oscillates above and below 0. You don’t need to worry about doing the calculation yourself; in FXOpen’s free TickTrader platform, you will find the Chaikin Volatility indicator and dozens of other tools waiting for you.
How to Trade With Chaikin Volatility
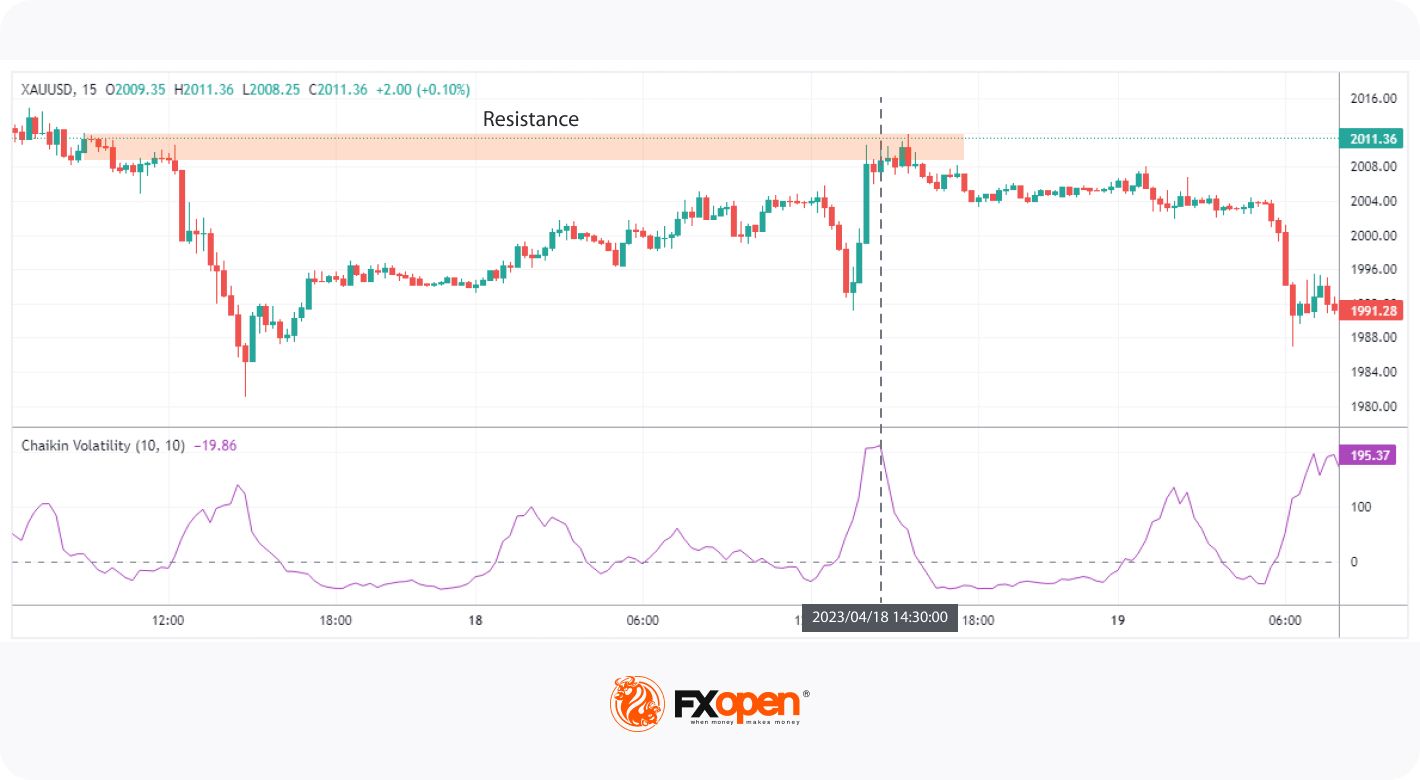
Including the Chaikin Volatility indicator in a strategy can offer traders a unique edge by providing insights into market events. Generally speaking, a rise in its value indicates an expanding trading range, which often precedes a substantial price move (normally a reversal).
However, determining whether an increasing value signals a reversal or a breakout can be tricky, as these spikes are relative to the defined period's range. Hence, traders consider the wider context and look for spikes at key technical areas like support/resistance levels or overbought/oversold zones, as suggested by indicators like the relative strength index (RSI).
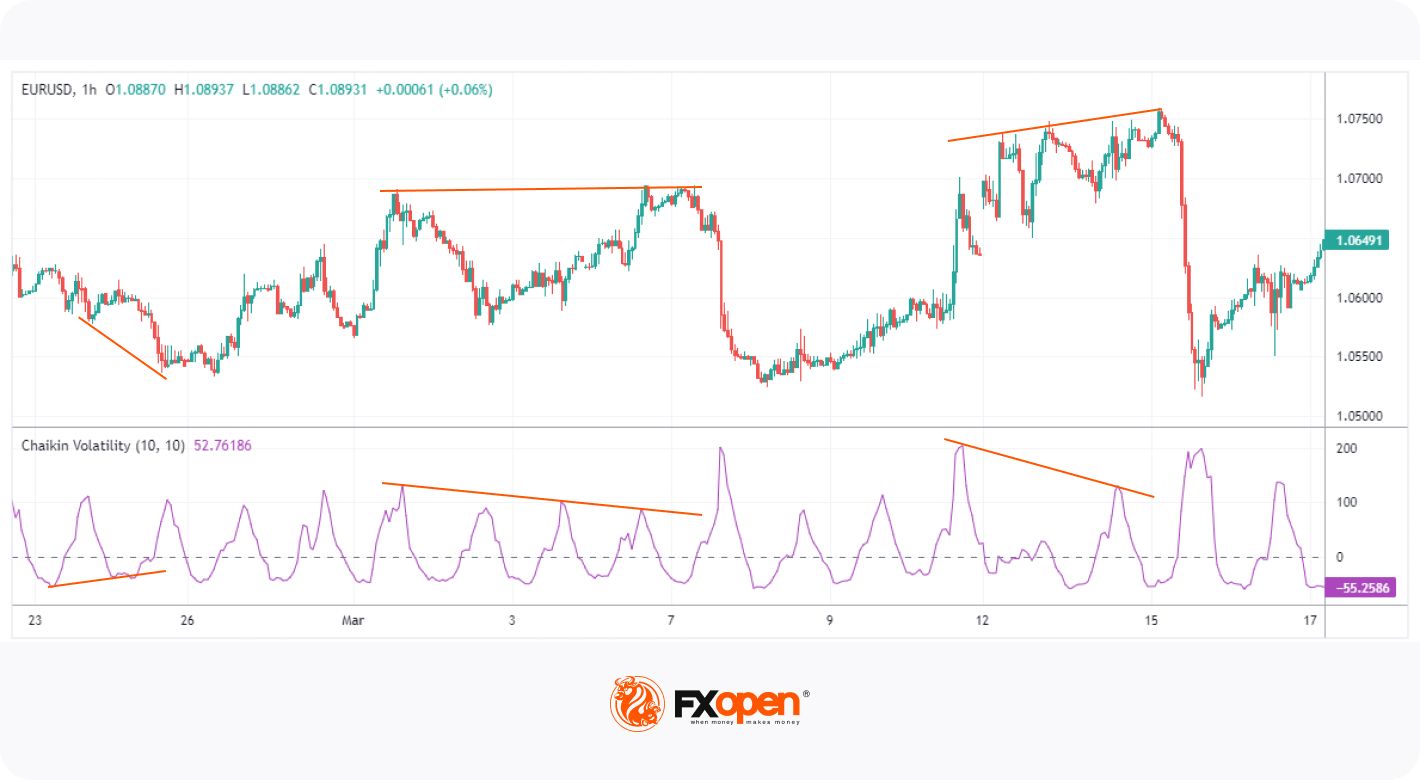
Much like the RSI, traders can use the indicator to spot waning buying or selling pressure. This occurs when the price fluctuations decrease at a seeming top or bottom, typically over an extended period.
Effectively, traders look for the highs in the indicator to diverge from price. This means that while the price may be reaching new highs (in a bearish reversal) or new lows (in a bullish reversal), the tool should be creating lower highs and higher lows, respectively. This divergence demonstrates that interest in the asset is dying down and that a reversal may be due.
Common Mistakes to Avoid
To maximise the effectiveness of the Chaikin Volatility Indicator, it’s important to be aware of some common mistakes.
Misinterpreting Volatility: A common misconception is that high value equals bullish and low value equals bullish. Remember, the tool measures price fluctuations, not an asset’s direction.
Overreliance: Like any other indicator, Chaikin Volatility should not be used in isolation. It's best used in combination with other forms of technical analysis to confirm its signals.
Ignoring the Market Context: Always consider the broader context. If the chart is trending strongly in one direction, even seemingly accurate signals may not result in a price reversal.
The Bottom Line
In summary, Chaikin Volatility is an invaluable tool that traders can use to better understand the markets. While not as popular as other similar measures, it’s definitely worth experimenting with this indicator to see how it could fit into your strategy. Once you feel ready, you can open an FXOpen account to apply the indicator to over 600 markets in the advanced TickTrader platform. Good luck!
This article represents the opinion of the Companies operating under the FXOpen brand only. It is not to be construed as an offer, solicitation, or recommendation with respect to products and services provided by the Companies operating under the FXOpen brand, nor is it to be considered financial advice.
Stay ahead of the market!
Subscribe now to our mailing list and receive the latest market news and insights delivered directly to your inbox.


Latest articles

Oracle (ORCL) Shares Jump Above $160
Following a strong earnings report, Oracle shares surged above $160, marking roughly a 1.5-month high:
→ Earnings per share: expected $1.70, actual $1.79;
→ Revenue: expected $16.7bn, actual $17.2bn.
This is the first quarter in 15 years

USD/JPY Approaches Key Resistance Level
The USD/JPY chart shows a bullish trend at the start of March, influenced by the escalation of military activity in the Middle East.
On one hand, the US dollar is strengthening due to increased demand for safe-haven assets. On