


PD Arrays in ICT: What They Are and How They Work
FXOpen

In ICT trading methodology, the PD Array—short for Premium and Discount Array—refers to a framework used to interpret how price moves within market structure. It provides a way of analysing price action by categorising reference points such as support, resistance, and liquidity levels. The PD Array is used by traders to place market activity into context rather than relying on isolated signals. This article breaks down what a PD Array is, its components, and how it might be applied within ICT concepts.
What Is a PD Array?
An ICT PD array, short for Premium and Discount array, is a concept developed by Michael J. Huddleston, the mind behind the Inner Circle Trader (ICT) methodology. At its core, the PD array is a framework used to organise price levels and zones on a chart where significant institutional activity is likely to occur. These zones highlight areas of interest such as potential support or resistance, points where liquidity resides, or regions that might attract price movement.
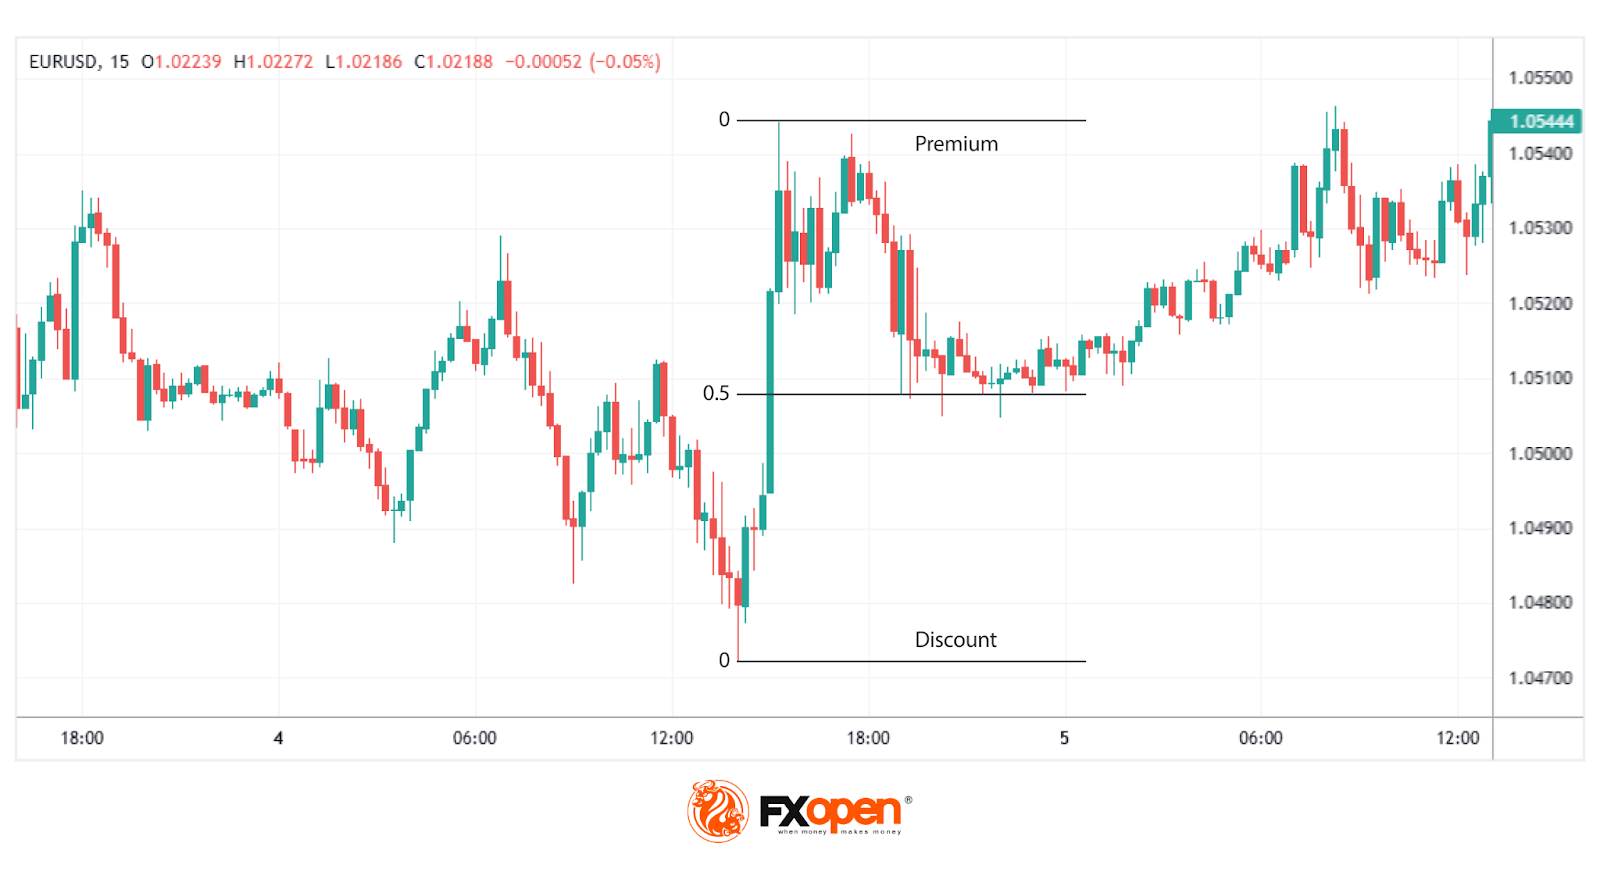
The PD array divides the market into two primary zones: premium and discount. These zones may help traders gauge whether the price is above or below its equilibrium, often calculated using the 50% level of a significant price range. In practical terms, prices in the premium zone are typically considered attractive in a downtrend and unattractive in an uptrend, while prices in the discount zone are more attractive in an uptrend and less attractive in a downtrend.
Beyond premium and discount zones, PD arrays include specific elements like order blocks, which are regions linked to institutional buying or selling, and fair value gaps (FVGs), which are imbalances or gaps in price that the market often seeks to revisit. Together, these elements create a structured roadmap for traders to interpret price behaviour.
Unlike a static indicator, an ICT PD array is dynamic and requires traders to interpret price movements in real time, considering the broader market context. It’s not a quick fix but a methodical approach to understanding how price delivers across different levels, offering a clearer view of where high-probability reactions could occur. The PD array is often combined with other ICT concepts, like market structure shifts or SMT divergence, to sharpen analysis.
Premium and Discount Zones of a PD Array
The foundation of a PD array starts with defining the premium and discount zones. This is typically done by identifying a significant price swing—either a low to a high or vice versa—and applying a Fibonacci retracement. The 50% level of this range serves as the equilibrium point, dividing the chart into two zones:
- Premium zone: Price levels above 50%, often considered less attractive in an uptrend and more attractive in a downtrend.
- Discount zone: Price levels below 50%, seen as more attractive in an uptrend and less attractive in a downtrend.
This equilibrium acts as a baseline, which may help traders assess whether the price is likely to reverse, consolidate, or continue based on its position relative to the 50% mark.
Tools Within the PD Array
The PD array doesn’t rely on a fixed set of tools. Instead, it offers a collection of components traders can use to refine their analysis. While the choice of tools can vary, they’re often ranked in a loose hierarchy, known as a PD array matrix, based on their importance within the ICT methodology. Let’s break down how this structure works.
Order Blocks
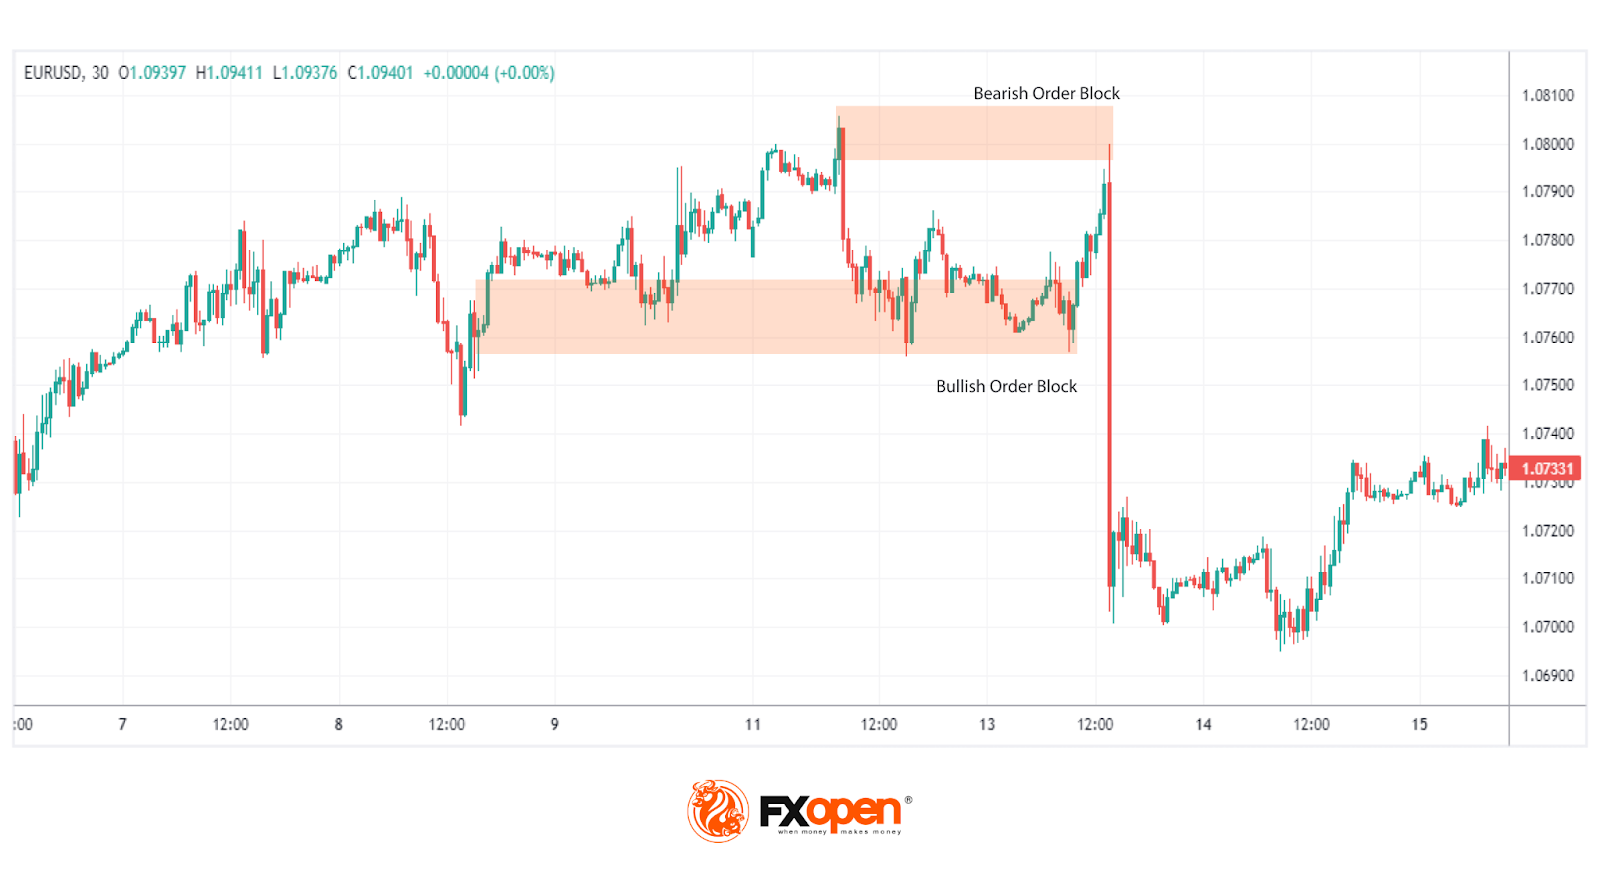
Order blocks are areas where institutional traders placed large buy or sell orders, often leading to significant price moves. On a chart, they appear as the last bullish or bearish candle before a sharp reversal. Order blocks are highly prioritised within the PD array because they indicate zones of potential support or resistance.
Fair Value Gaps (FVGs)
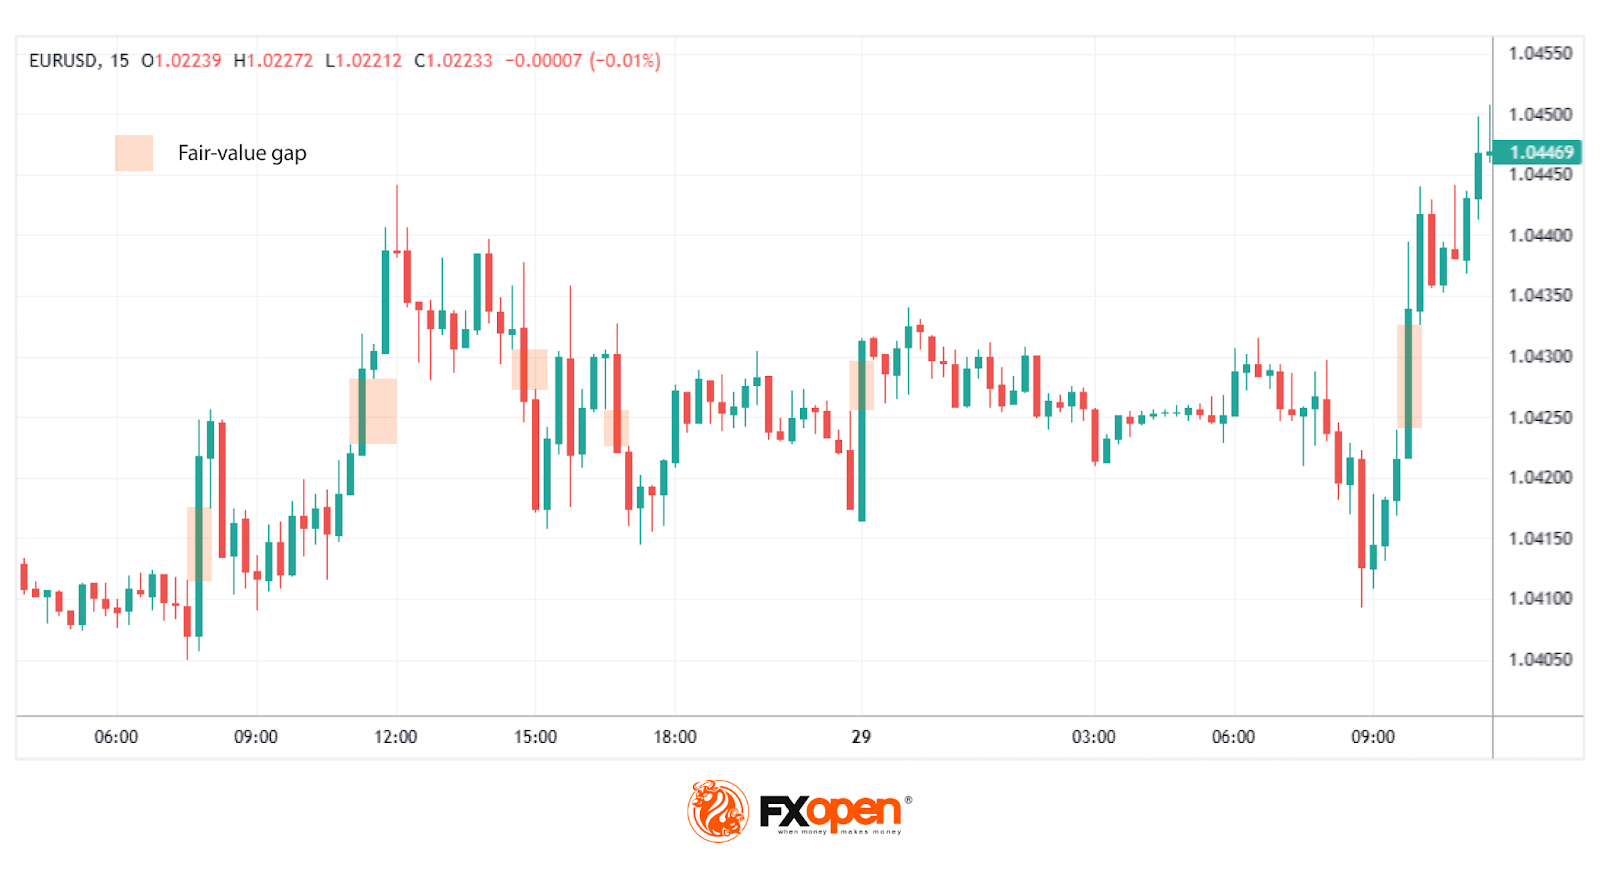
FVGs are gaps between price levels that form when the market moves too quickly to fill orders evenly. These imbalances create "unfinished business" in the market, and price often revisits these areas to restore balance. They are especially useful for spotting potential reversals or continuation points.
Breaker Blocks
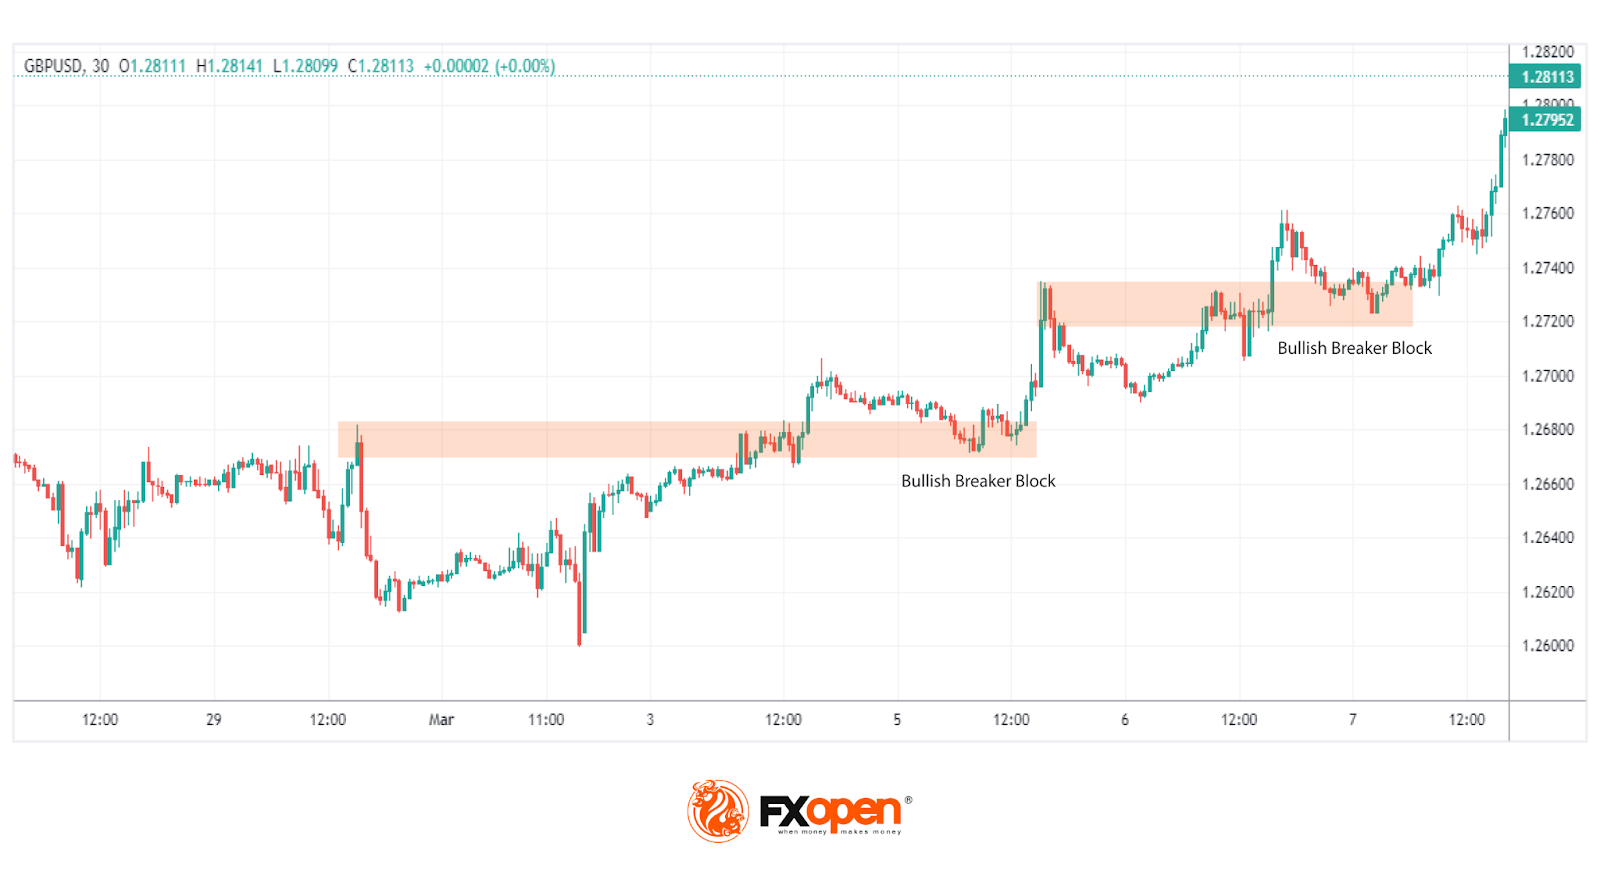
Breaker blocks form when order blocks fail. When supply or demand zones are unable to hold and the market structure shifts, breaker blocks emerge, highlighting levels to monitor.
Mitigation Blocks
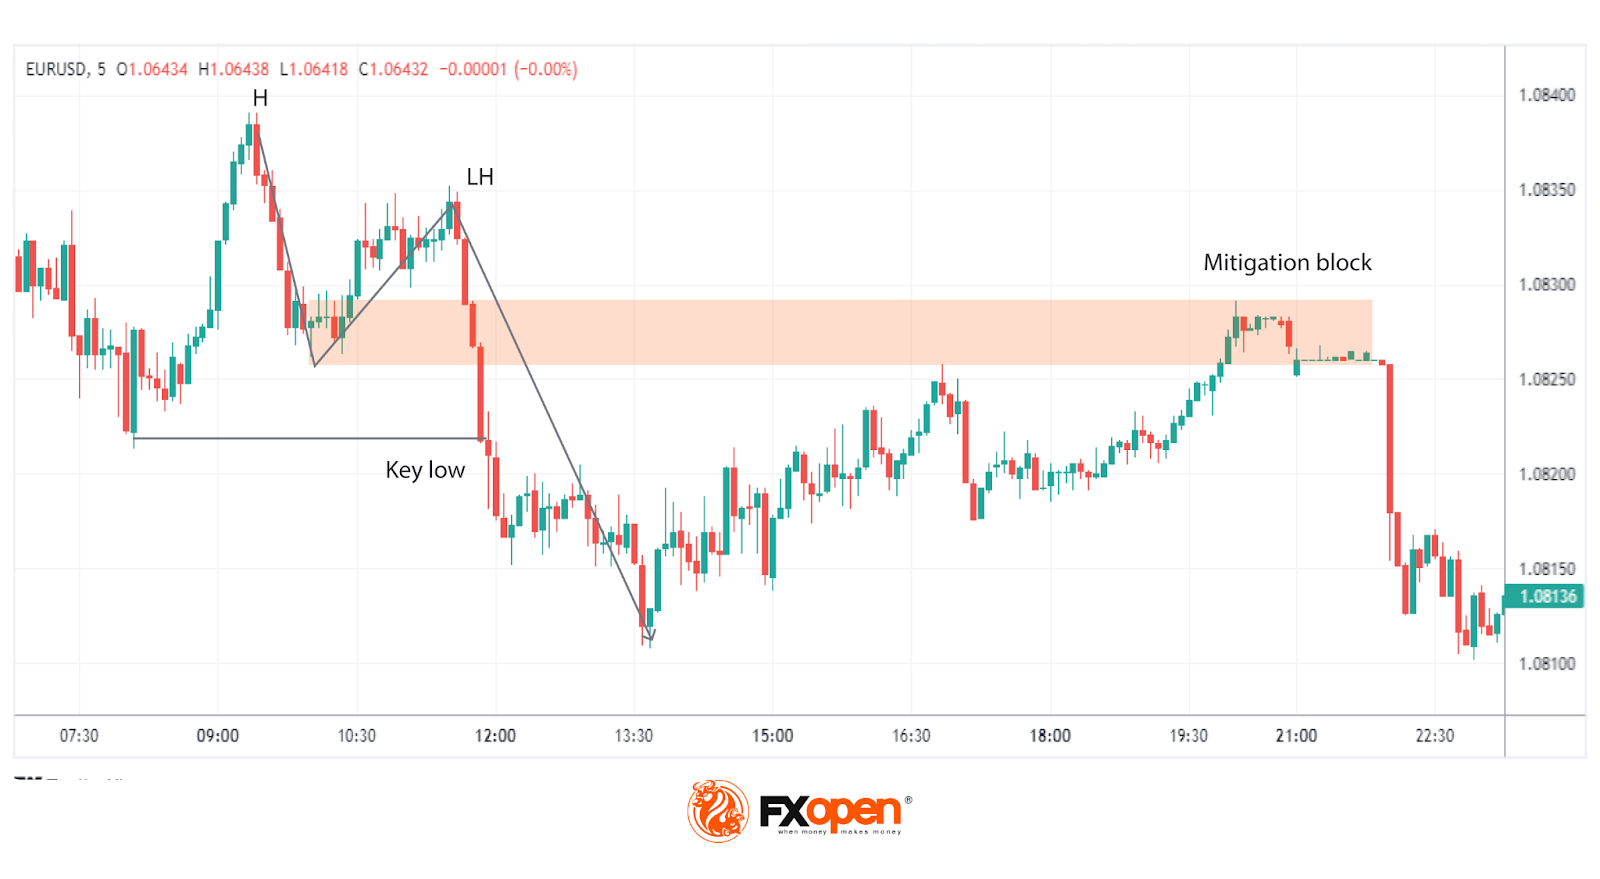
Mitigation blocks are related to breaker blocks but form after a market structure shift, where the price makes a lower high (in an uptrend) or a higher low (in a downtrend). They function the same as breaker blocks, but the key difference is in the failure of a new high/low before the trend reverses.
Liquidity Voids
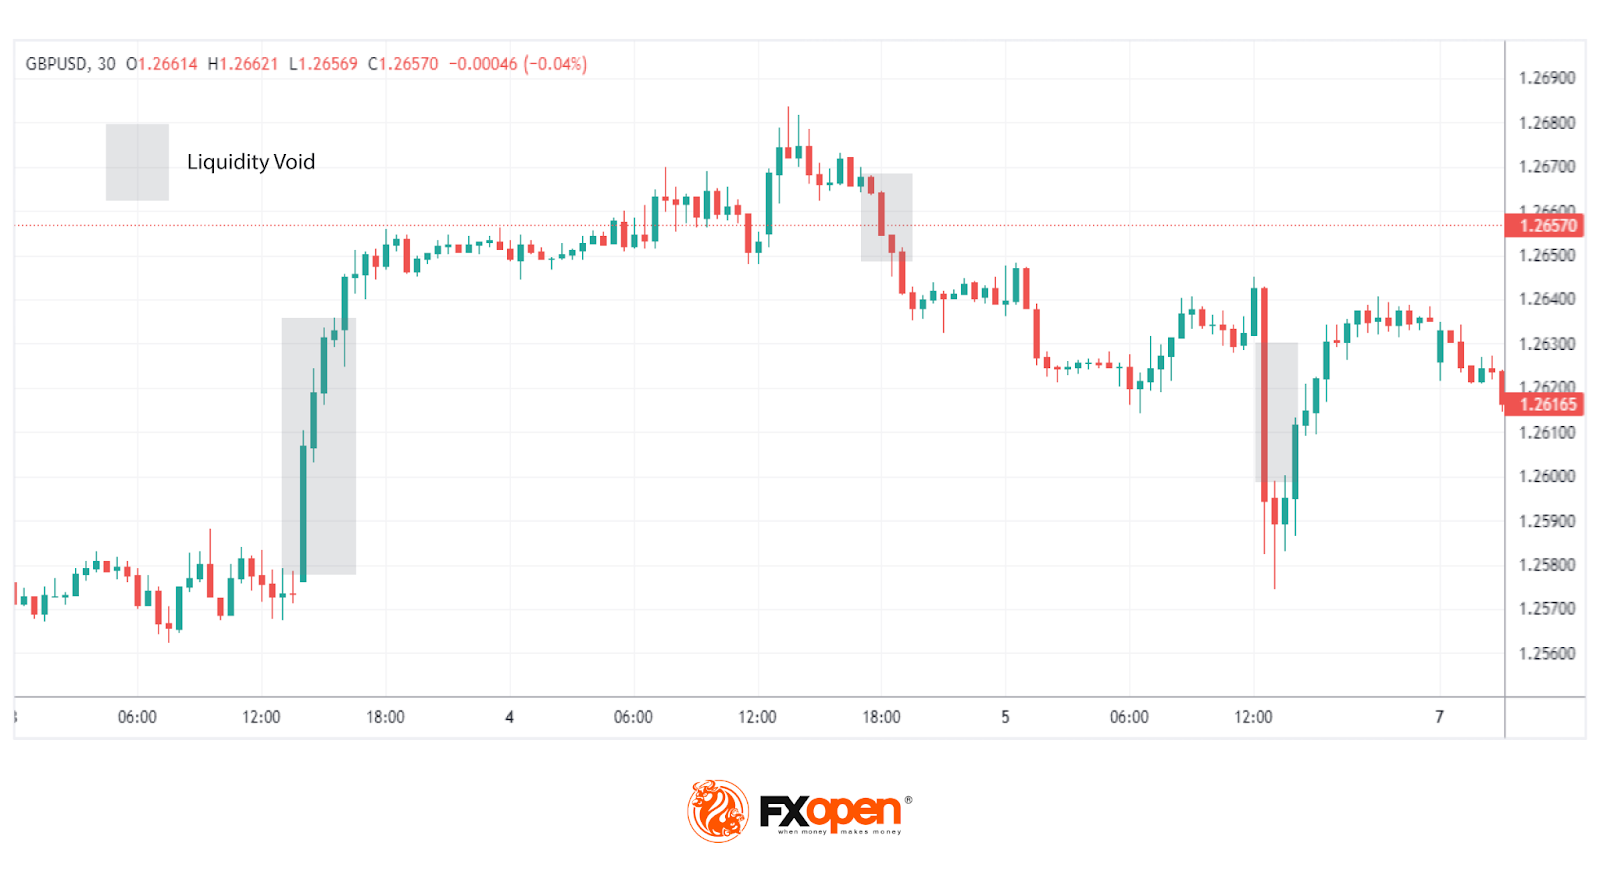
Liquidity voids are areas on the chart where there’s little to no trading activity, often following sharp price movements. These large FVGs are often revisited by price as the market seeks to rebalance liquidity, making them significant for identifying future price movements.
Rejection Blocks
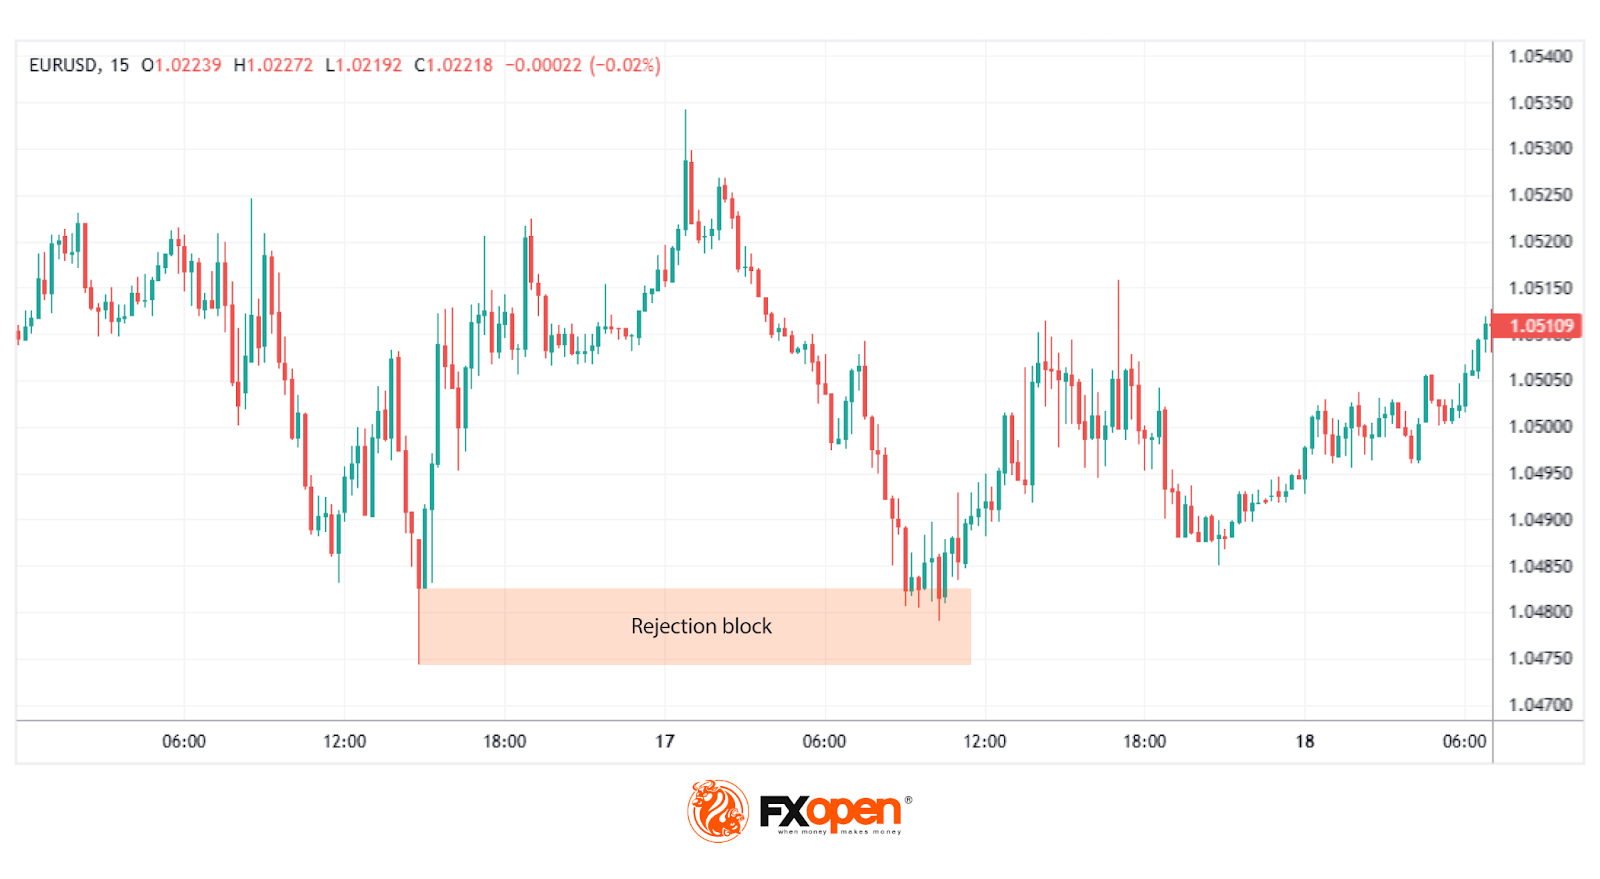
ICT rejection blocks are similar in concept to order blocks but consist of the wicks present on a given timeframe where an order block could be drawn. They are essentially a refined version of an order block where the price may reverse.
Old Lows or Highs
Old lows or highs represent liquidity pools where traders place stop orders. These levels are magnets for the price, as the market often seeks to trigger these stops before reversing. Identifying these points may help traders anticipate where the price might gravitate.
Traders can explore these concepts and more on FXOpen’s TickTrader platform.
Using ICT PD Arrays for Trading
Let’s consider how the PD array of the ICT methodology might be used.
Evaluating Trend Structure
Before anything else, traders typically assess the broader trend by analysing highs and lows. The goal is to identify the current structure and wait for the market to form a new significant high or low that aligns with the existing trend. For instance, in an uptrend, a trader might wait for a new higher high to form, followed by a retracement.
Once the new high or low is established, traders often draw a Fibonacci retracement tool between the previous low and the recent swing high (or vice versa for a downtrend). This creates a clear division of the price range into premium and discount zones, providing the foundation of the PD array.
Retracement into the PD Array
As the price retraces within the range, traders watch for it to reach the premium zone in a downtrend or the discount zone in an uptrend. This positioning suggests that the price has reached an area where the risk-reward balance could be more notable.
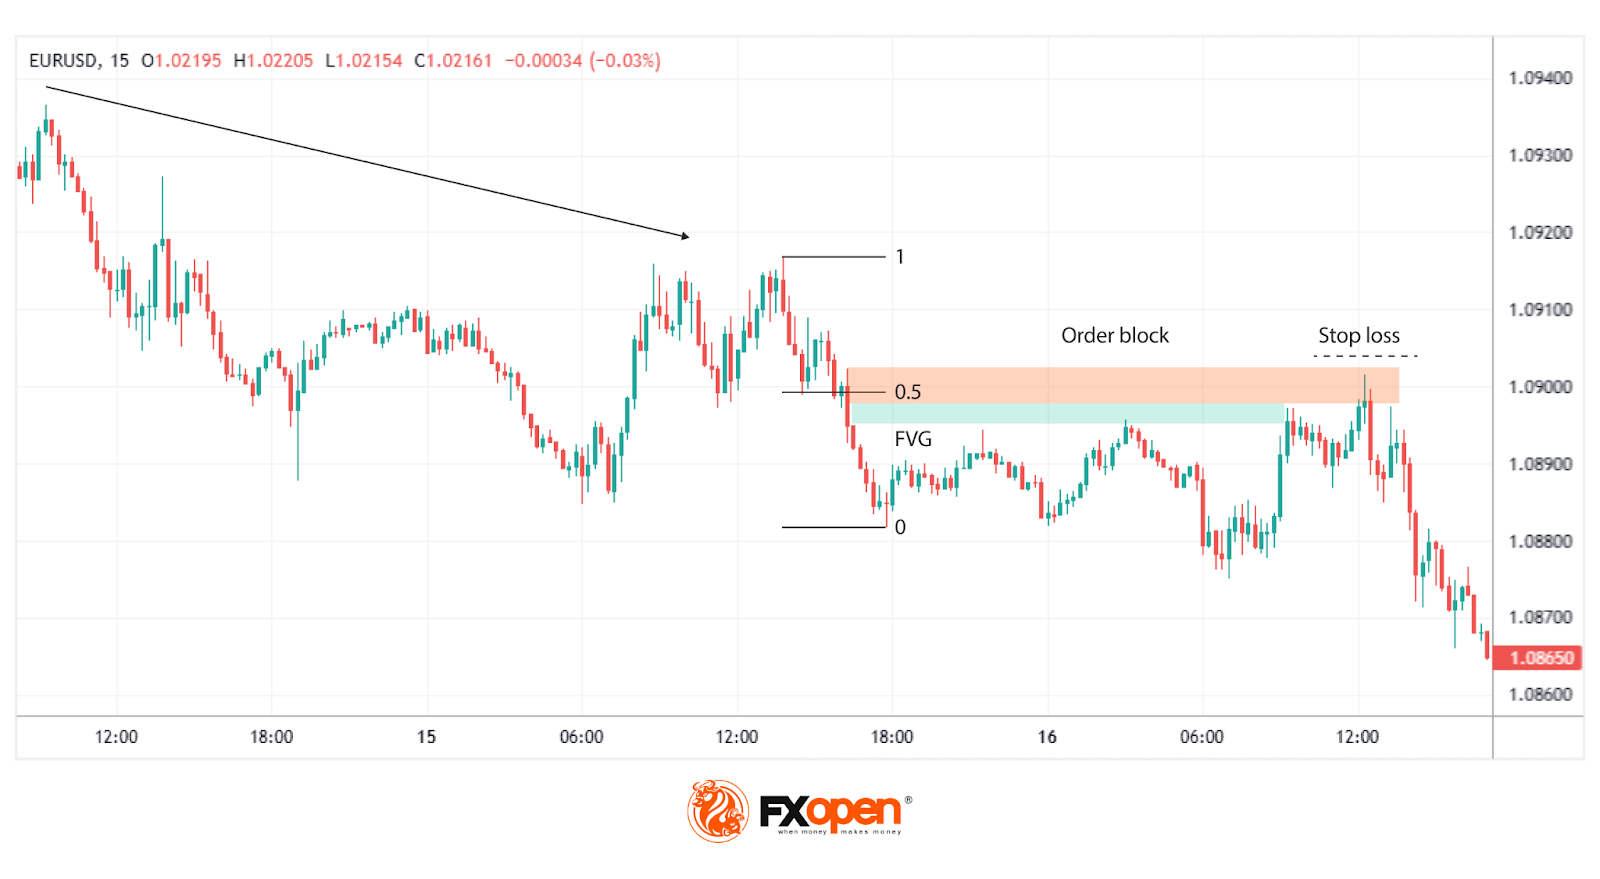
Finding Specific Setups
Within these zones, traders use the tools of the PD array to refine their approach. For instance, an FVG might act as a key level, particularly if it sits just ahead of an order block. Alternatively, a breaker block might signal a potential reversal if the price aligns with the broader trend structure. By combining these elements, traders can narrow their focus to setups that align with both the PD array and the underlying market conditions.
The Limitations of ICT PD Arrays
While ICT PD arrays offer a structured framework for analysing price behaviour, they’re not without their challenges. Traders relying on this methodology should be aware of its limitations to avoid potential pitfalls. Here are some important considerations:
- Subjectivity in Marking Zones: Identifying premium and discount zones, as well as order blocks or other components, can vary between traders. This subjectivity means that no two analyses are identical, which may lead to inconsistent outcomes.
- Experience Required: PD arrays demand a solid understanding of market structure, liquidity concepts, and the ICT methodology. It can feel overwhelming for beginners without adequate practice.
- Higher Timeframe Dependence: While PD arrays are valuable, they’re more popular on higher timeframes. Traders focusing solely on smaller timeframes might encounter more false signals.
- Dynamic Nature: Markets evolve quickly, and PD arrays require traders to adapt in real time. This dynamic quality can be a challenge for those who struggle with decision-making under pressure.
- Overfitting Risk: With so many tools available within the ICT framework, it’s easy to overanalyse or misinterpret signals, leading to analysis paralysis.
The Bottom Line
ICT PD arrays offer traders a framework for analysing market movements and identifying important price zones. By combining these arrays with other tools and techniques, traders may gain deeper insights into institutional activity. To put these concepts into practice, you may consider opening an FXOpen account and access advanced trading tools alongside competitive trading conditions to explore the potential of ICT methodologies in real markets.
FAQ
What Is the ICT PD Array?
The ICT PD array meaning refers to a Premium and Discount array, a trading concept developed within the Inner Circle Trader (ICT) methodology. It organises price levels and zones into premium and discount areas, which may help traders analyse where the price is likely to react and reverse and place entry and exit points. The framework includes tools like order blocks, fair value gaps, and liquidity voids to identify potential areas of institutional interest.
What Is a Premium Array in Forex?
A premium array in forex refers to the portion of a price range above its equilibrium level, typically the 50% mark of a significant swing high and low. Traders consider this zone less attractive for buying, as it’s closer to overvaluation, but often look for potential sell trades.
What Is a Discount Array in Forex?
A discount array is the zone below the equilibrium level of a price range. It represents an area associated with potential buying interest, as prices are considered undervalued relative to the swing high and low.
This article represents the opinion of the Companies operating under the FXOpen brand only. It is not to be construed as an offer, solicitation, or recommendation with respect to products and services provided by the Companies operating under the FXOpen brand, nor is it to be considered financial advice.
Stay ahead of the market!
Subscribe now to our mailing list and receive the latest market news and insights delivered directly to your inbox.


Latest articles

NVIDIA: Kyber NVL144 Dispute Weighs on the Stock
NVIDIA shares found themselves at the centre of debate over the future of the Kyber NVL144 system. On 6 July, CNBC, citing research firm SemiAnalysis, reported that the project could be delayed by more than a year—from 2027 to

EUR/GBP: Trendline Support or Breakdown to New Lows?
EUR/GBP has slid to its weakest level in a year, as the two currencies continue to follow increasingly divergent paths. The ECB's June hike—its first since 2023—was meant to signal renewed hawkishness, but the very next inflation

USD/CAD: One Trendline Away From Deciding the Next Move
After several strongly positive weeks, USD/CAD has stalled over the past few sessions, entering a phase of uncertainty.
On the dollar side, Fed Chair Kevin Warsh has struck a firm tone, reaffirming the 2% inflation target and pushing back