


What Is an Alligator Indicator and How Should You Use It?
FXOpen
An alligator technical indicator is one of the tools traders implement in trend trading. An alligator isn’t only a name; the indicator consists of teeth, lips, and a jaw. Although it may sound unserious, it provides reliable signals. This FXOpen guide will tell you how to read the alligator’s signals and use them to catch the perfect entry and exit points.
What Is an Alligator Indicator?
An alligator indicator, also known as a Williams alligator indicator, is a technical analysis tool developed by the famous trader Bill Williams, who also created the Awesome Oscillator (AO) and the Market Facilitation Index. He is considered one of the pioneers of trading psychology, and his views on chaos theory are popular in the financial industry.
How to Read an Alligator Indicator
The alligator is a trend indicator that alerts traders about the formation of a new trend and its direction. Therefore, it's widely used in trend trading strategies. The alligator consists of three lines which are smoothed simple moving averages (SMAs).
Moving averages are primary tools for identifying trend directions and have been used to build various technical indicators, like Bollinger Bands and the moving average convergence divergence.
In the alligator indicator, the SMAs are smoothed to slow down indicator turns and make the signals more solid.
Calculation of the Alligator Indicator
You don’t need to calculate the moving averages; they are automatically calculated when you implement the indicator on a price chart. However, it’s worth knowing how the indicator is built to interpret its mechanics.
- Jaw (blue). The jaw line is the slowest moving average. Typically, it has a period of 13 and is shifted 8 bars forward.
- Teeth (red). It’s an 8-period smoothed moving average shifted 5 bars forward.
- Lips (green). It’s the fastest moving average with a standard period of 5 and a shift of 3 bars forward.
Interestingly, the standard alligator settings are 5, 8, and 13, which are Fibonacci numbers that are widely used in trading.
Note: the colours and periods are customizable, but as the standard indicator is represented by red, blue, and green lines and 5, 8, and 13 periods, we will stick to them. You can set up the indicator in accordance with your preferences on the TickTrader platform.
How to Use the Alligator Indicator
As the indicator consists of three lines, traders consider their interaction. A crossover is a major signal.
Lack of a Trend
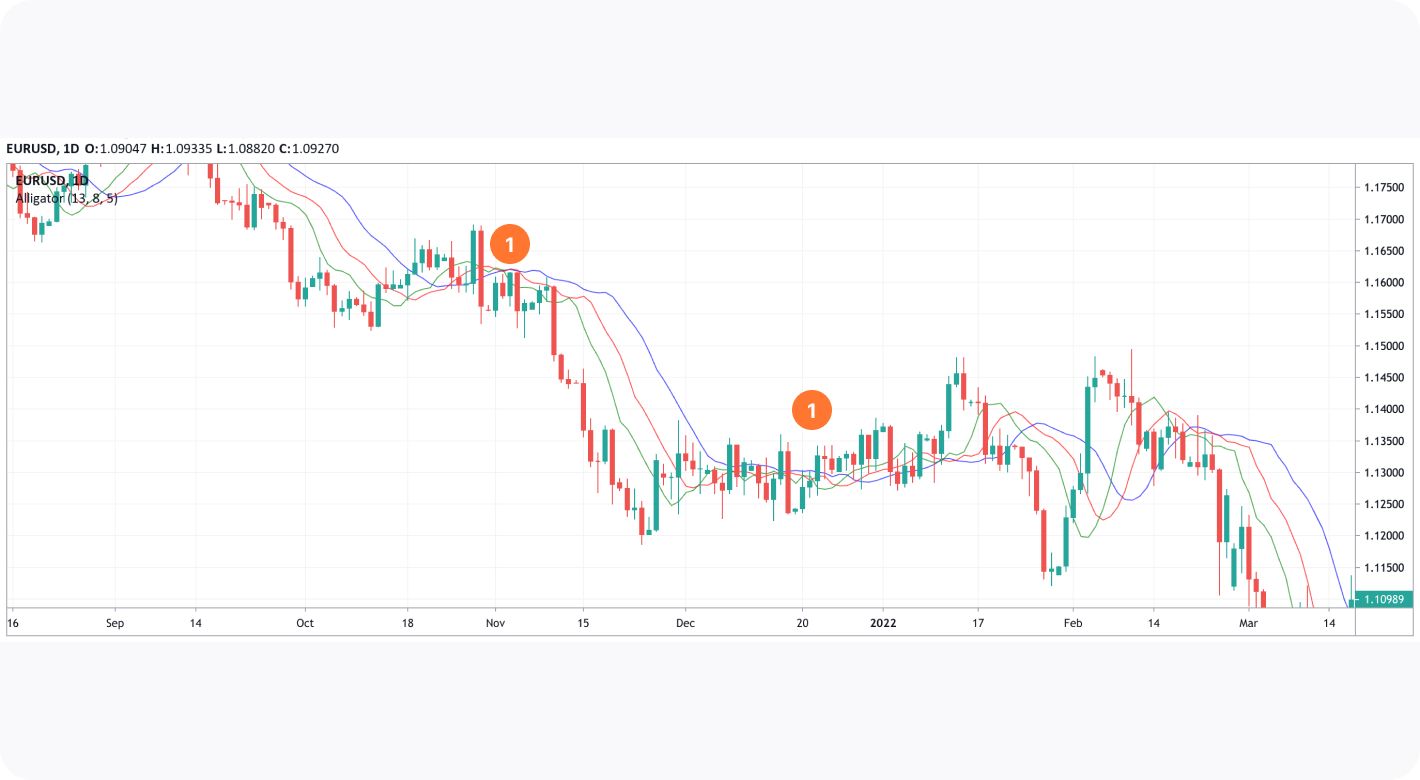
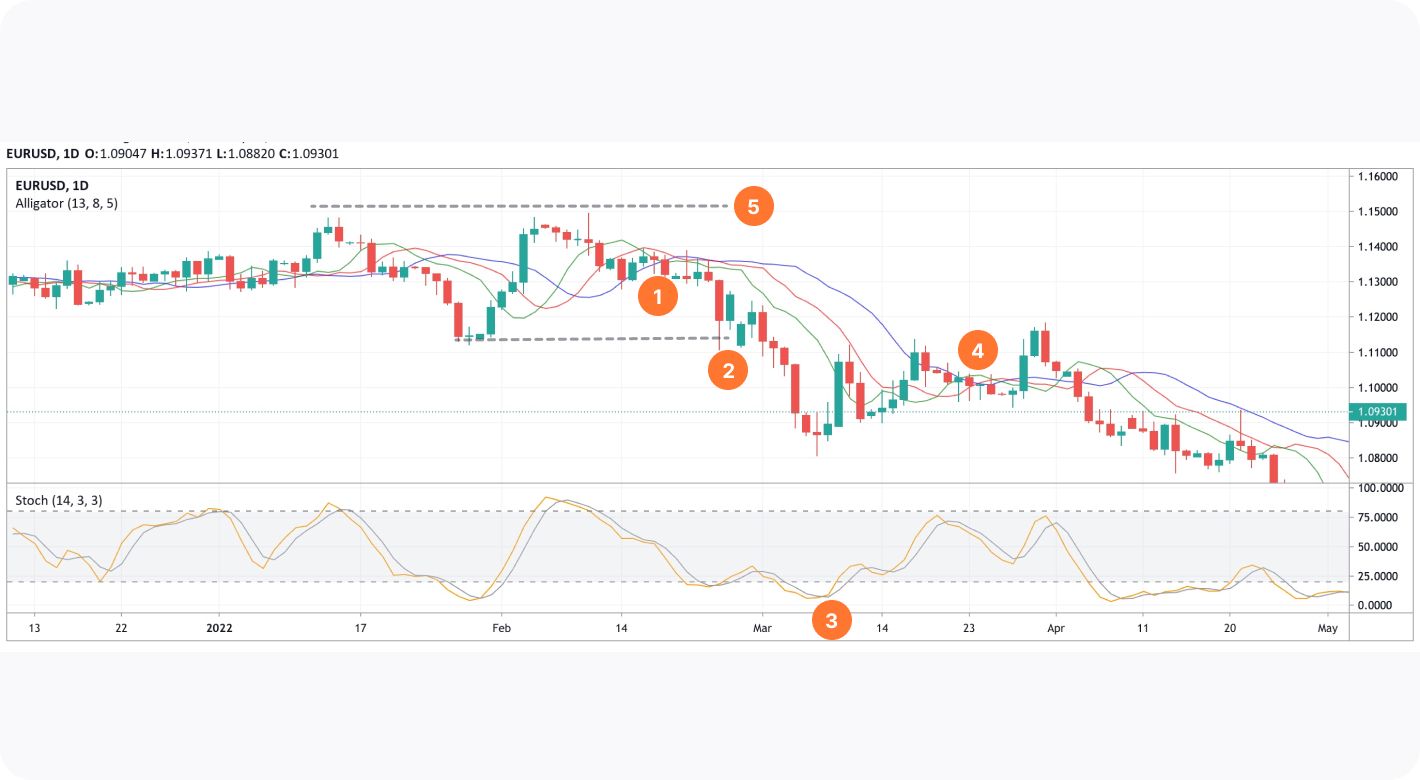
When all three smoothed moving averages are entwined and move horizontally, the market moves sideways, and the indicator reflects the absence of a trend (1). In such periods, traders can use the alligator to confirm the market consolidation and use range-bound strategies.
Trending Market
As soon as the distance between MAs increases, it’s a sign the market is entering a trend. When at least two moving averages are implemented on a price chart, their essential signal is a crossover. When a moving average with a shorter period breaks above a moving average with a longer period, it’s a buy signal. Conversely, when an MA with a shorter period falls below the MA with a more extended period, it’s a sell signal.
The same logic applies to the alligator indicator. Traders closely track the fastest MA (lips). When it rises above other MAs, the indicator signals a formation of a bullish move (1). When it breaks below other MAs, the alligator predicts a bearish move (2). Once the trend is established, the moving averages follow it, moving up in an uptrend and down in a downtrend.
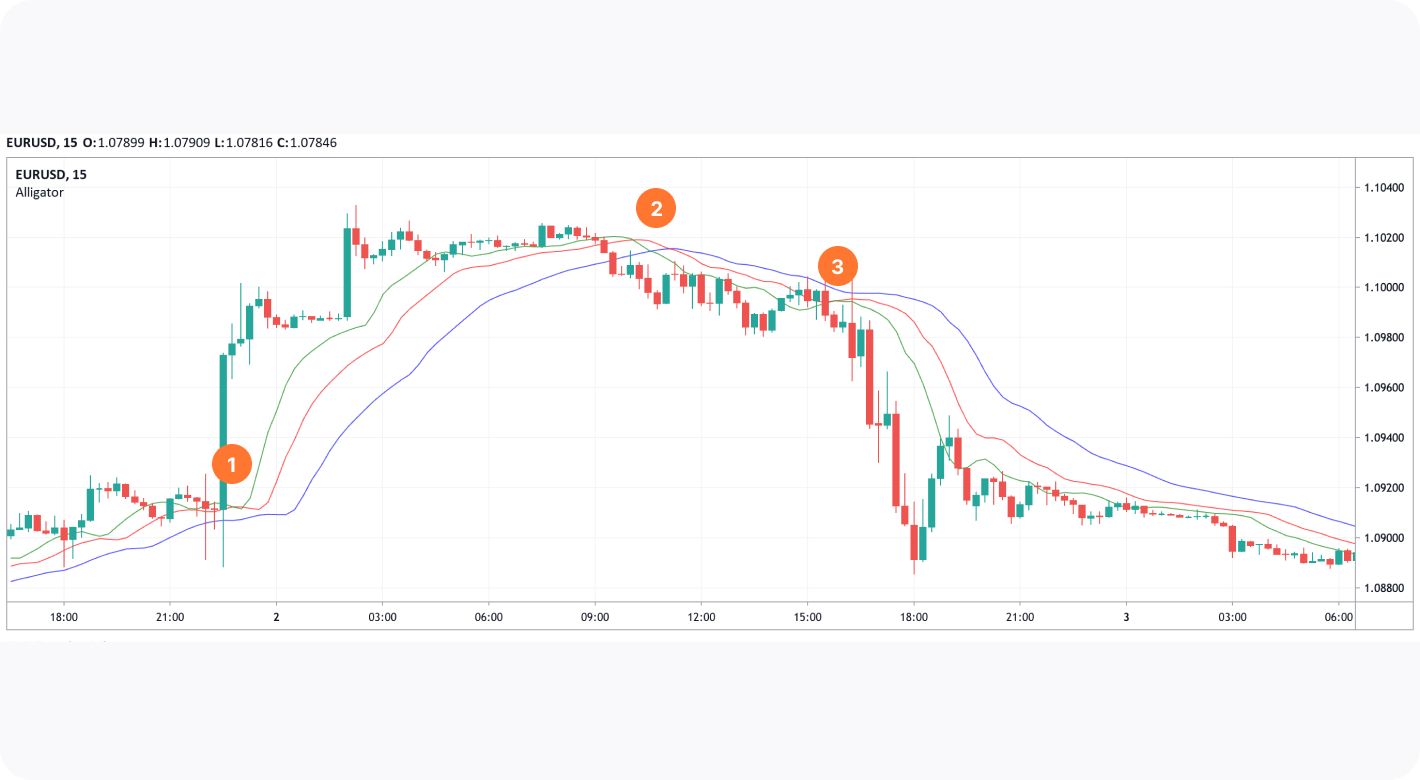
Note: it's vital to wait for the lip line to cross the jaw and teeth lines; otherwise, the signals will fail. In the chart above, the fastest MA crossed above the intermediate moving average bottom-up. A trader could consider it a buy signal. However, the line didn't break above the slowest moving average (3). As a result, the trend continued. Such situations constantly occur on short-term price charts.
An interesting idea lies behind the alligator method. When the market moves sideways, meaning there is no solid trend, the alligator is sleeping. Once buyers or sellers are ready to take control of the market, the alligator wakes up and opens its mouth. During a trend, the moving averages are far from each other, which is associated with an alligator "eating with a wide-open mouth."
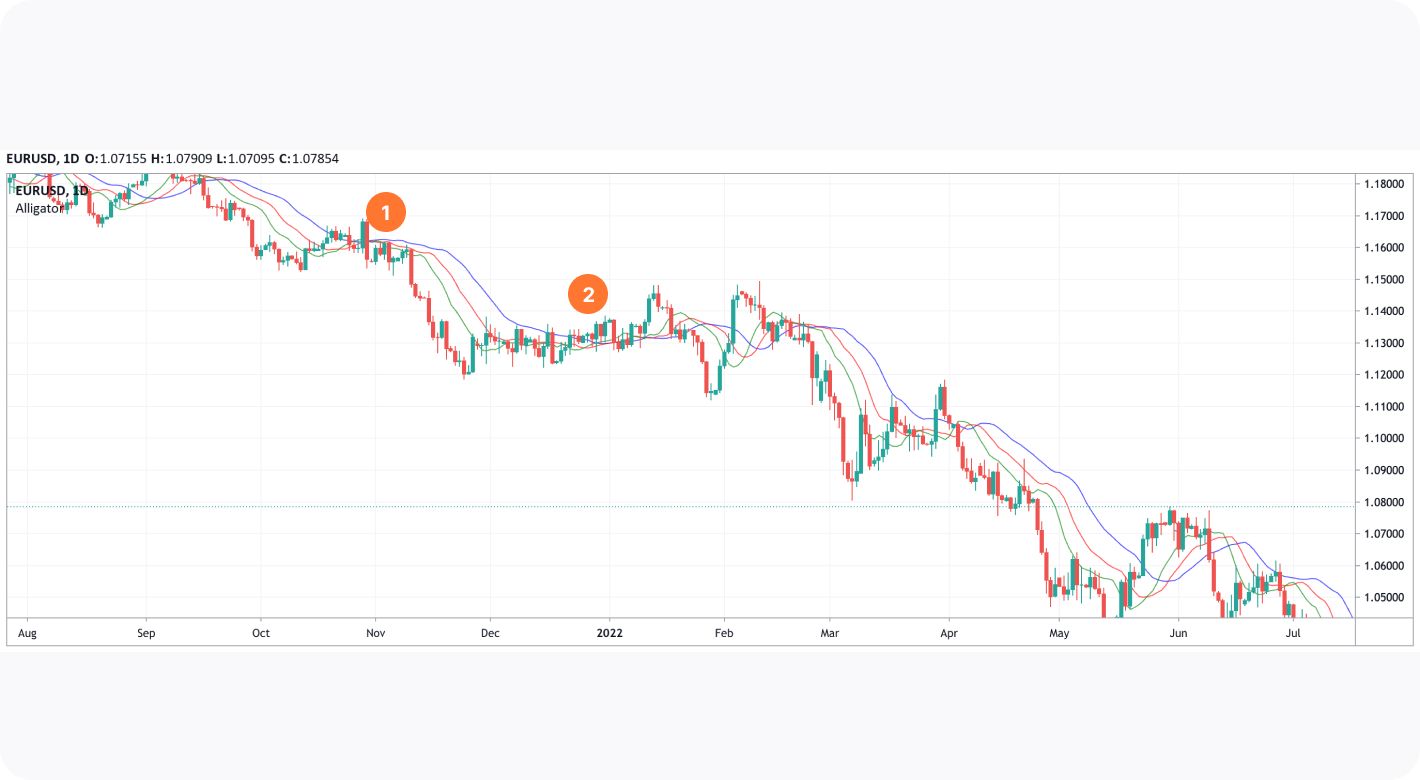
The longer the alligator sleeps, the more hungry it is and the stronger the trend is. This rule is confirmed in the chart above. The downtrend after a short-term consolidation (1) lasted less than a downtrend after a longer-term consolidation (2).
How to Trade with the Alligator
Alligator trading is simple. A trader buys when the fastest MA rises above other MAs and sells when the fastest MA falls below other MAs. Below you will find one of the possible forex alligator strategies. However, you can develop your own rules and use the indicator not only for forex trading but in the stock, commodity, and cryptocurrency* markets.
Entry
In the chart above, the alligator provided a sell signal (1). A trader would enter the market, not at the early stages of a downtrend, but the signal is reliable. As the alligator is based on moving averages and a moving average is a lagging indicator, the alligator’s signals may appear with a delay.
Note: lagging indicators provide signals with a delay, thus, confirming the current price move. Therefore, they are used in solid trends and can lead to missed trades when applied to short-term timeframes or short-term trends.
Take Profit
The market would allow a trader to take profit at three different points. First, a trader could place a support level at the nearest lows (2). However, as the trend was solid, they would miss an opportunity to gain more. By using a trailing take-profit, they could exit the market when the %K line of the stochastic oscillator breaks above its %D line in an oversold area (3). This would be a signal of a price reversal. Also, a trader could wait for the fastest MA to break above other moving averages (4). However, in the third case, they would exit the market later and lose a part of the potential profit.
Stop Loss
A stop-loss level could be calculated with the risk/reward ratio of 1:2 if a trader knew the take-profit target as in the first case. If a trader used the stochastic or the alligator signals, a stop-loss level could be placed above the recent highs (5).
Special Consideration
The rules look simple and work in many cases but not all. In the chart below, the green line (fast MA) broke below other moving averages, which was supposed to become a signal of a downtrend (1). However, a solid downtrend started later (2). Until then, the price was moving up and down.
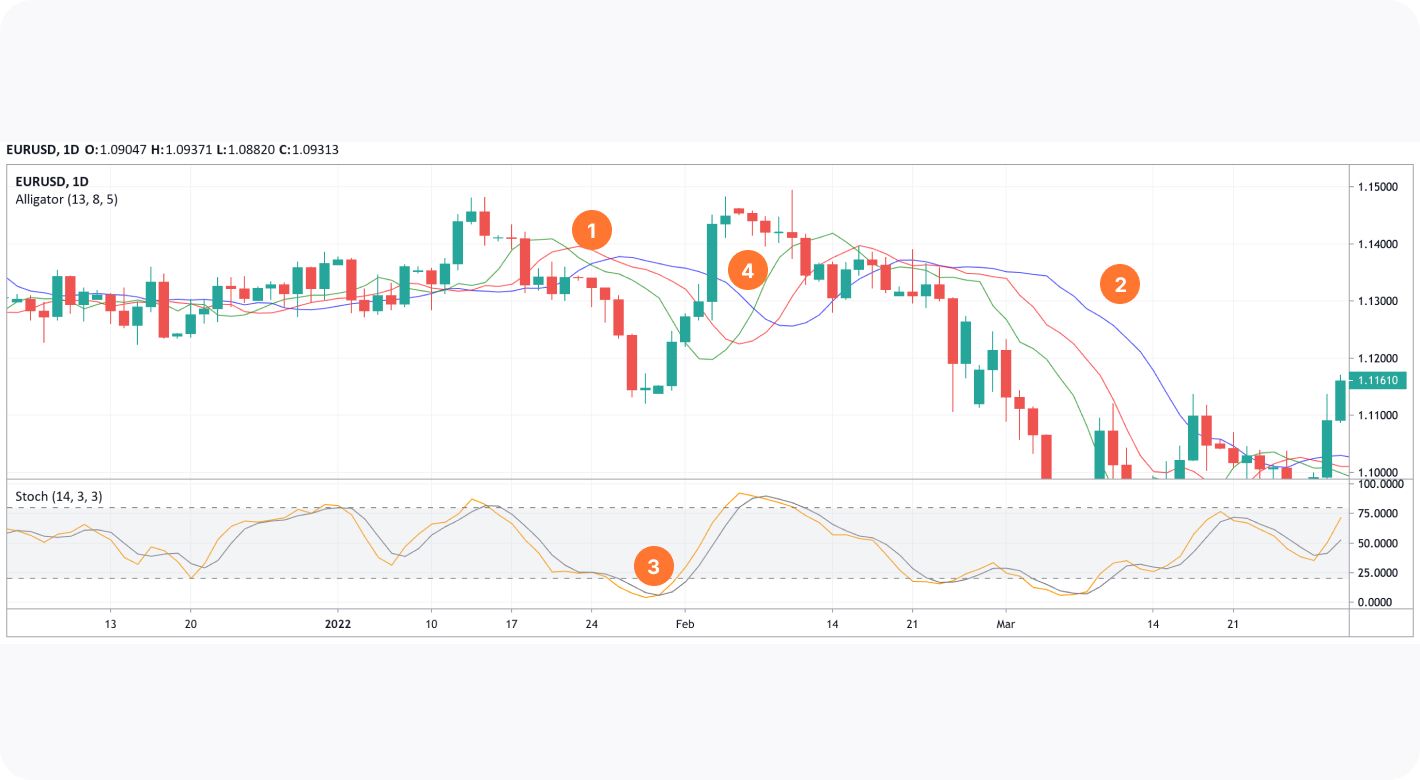
A trader could go short, but additional tools would be required to exit the market with a profit. For example, a trader could have opened a sell position when the alligator provided a sell signal (1). However, they would have used the stochastic oscillator to exit the market. When the indicator stayed in the oversold area, the %K line broke above the %D line. It was a signal of a price increase (3). If they waited for the fastest MA to break above other MAs, they would lose almost all their profit.
How to Confirm Alligator Signals
The theory says traders should use 2-3 signals of different technical analysis tools, including indicators, candlesticks, and chart patterns, before entering and exiting the trade.
You have noticed that the alligator works with the stochastic oscillator. Other tools you can use are the relative strength index and the moving average convergence divergence. Also, you can consider reversal candlestick patterns.
Final Thoughts
The alligator chart indicator is one of the commonly used technical analysis tools. It provides effective signals in trending markets. As its trading rules are simple, a trader with any level of experience can use it and develop their own alligator indicator strategy. You can open an FXOpen account and examine alligator indicator trading.
*At FXOpen UK, Cryptocurrency CFDs are only available for trading by those clients categorised as Professional clients under FCA Rules. They are not available for trading by Retail clients.
This article represents the opinion of the Companies operating under the FXOpen brand only. It is not to be construed as an offer, solicitation, or recommendation with respect to products and services provided by the Companies operating under the FXOpen brand, nor is it to be considered financial advice.
Stay ahead of the market!
Subscribe now to our mailing list and receive the latest market news and insights delivered directly to your inbox.


Latest articles

Analytical Tesla Stock Price Predictions for 2026–2030
Tesla (TSLA) is

European Currencies Seek Stability Amid Rising Geopolitical Tensions
European currencies are showing mixed performance as they attempt to stabilise following their recent decline and the release of the Federal Reserve's latest meeting minutes. The minutes revealed growing concern over persistent inflationary pressures, with several policymakers supporting the possibility

Netflix: Attempting to Break the Short-Term Downtrend
Netflix is preparing to release its financial results for the second quarter of 2026. According to the company's official press release published on 15 June, the earnings report will be released on 16 July, followed by a video interview with