


What Is Contrarian Trading?
FXOpen
Contrarian trading challenges the traditional buy-low, sell-high paradigm by going against prevailing market trends. This article delves into the principles, psychology, and tools that shape this approach, offering insights for traders seeking to tap into overlooked or undervalued opportunities.
The Contrarian Philosophy
Contrarian thinking is fundamentally about challenging the prevailing market sentiment. While many traders and investors seek to capitalise on the momentum of trending stocks, commodities, or currencies, the contrarian trader takes a different route.
The very essence of being a contrarian trader means actively looking for opportunities that the majority overlooks or outright avoids. This involves buying assets that are out of favour and selling those that have garnered too much positive attention.
It's important to note that this isn't merely a reactionary stance. Rather, it's rooted in a deep-seated belief that the market often overreacts to news—both good and bad. Such overreactions create inefficiencies and opportunities for gain, especially when sentiments reverse. For instance, during market downturns, pessimism can lead to undervalued assets that are ripe for investment.
So, in a nutshell, contrarian trading is about strategically taking positions that are contrary to prevailing opinion, guided by research and analysis. A contrarian trader, meaning someone who employs this approach, seeks to capitalise on these inefficiencies by swimming against the tide of popular opinion.
The Psychology of Markets
Market psychology plays a crucial role in trading and investing, often manifesting as herd mentality. This is where large groups of traders and investors make decisions based on emotion rather than rational analysis. Herd behaviour frequently leads to bubbles or crashes as assets become overbought or oversold.
The best contrarian investors and traders pay close attention to these psychological factors, as they tend to create market inefficiencies. For instance, during a market frenzy, the market may push an asset's price too high, ignoring its intrinsic value. Conversely, widespread pessimism may result in an asset being undervalued. Contrarian traders use such psychological cues to identify trading opportunities that run counter to prevailing market sentiment.
Key Principles of Contrarian Trading
A successful contrarian trading approach hinges on several key principles. At the forefront is the concept of mean reversion, which postulates that asset prices will eventually revert to their historical average over time. Contrarian traders exploit this by buying undervalued assets or short-selling overvalued ones, anticipating a return to a more "normalised" price.
Contrarian analysis involves thorough research to identify such opportunities. This can mean delving into financial reports, market trends, and economic indicators, among other data points. In essence, the contrarian trader always searches for discrepancies between an asset's current market price and its intrinsic value.
Risk management is another pillar of the contrarian approach. Given the nature of going against the grain, contrarian traders often face high volatility and market risk. A well-crafted risk management plan is essential to navigate these turbulent waters.
A robust contrarian investment strategy also places a strong emphasis on timing. It's not enough to simply identify an undervalued or overvalued asset; knowing when to enter and exit the market is crucial for maximising returns. This requires a disciplined approach and a keen understanding of market triggers that could signal a reversal in sentiment.
Tools and Indicators
Here are the most common tools and indicators traders use for contrarian trading.
Indicators for Contrarian Trading
When it comes to identifying contrarian stocks, forex pairs, commodities, and crypto* assets, certain indicators stand out. The Relative Strength Index (RSI) and the Moving Average Convergence Divergence (MACD) are often employed to spot overbought or oversold conditions. Specifically, divergences in these indicators can signal a potential market reversal. Support and resistance levels also play a role, highlighting points where an asset's price is likely to change direction.
To leverage these tools effectively, a reliable trading platform is essential. Head over to FXOpen’s free TickTrader platform to access real-time charts and over 1,200 trading tools.
Tools for the Contrarian Trader
Beyond traditional indicators, other tools offer insights into market sentiment, which is critical for contrarian trading. The VIX Index gauges market volatility and can be inversely correlated with US market sentiment. Trading volume may confirm a contrarian viewpoint, especially if it diverges from price action.
The Commitment of Traders (COT) report also unveils the positions of different market participants, helping traders gauge the prevailing sentiment. Finally, the Fear and Greed Index provides a quick snapshot of investor emotions, allowing contrarian traders to act against extreme psychological states.
Example Contrarian Trading Strategy
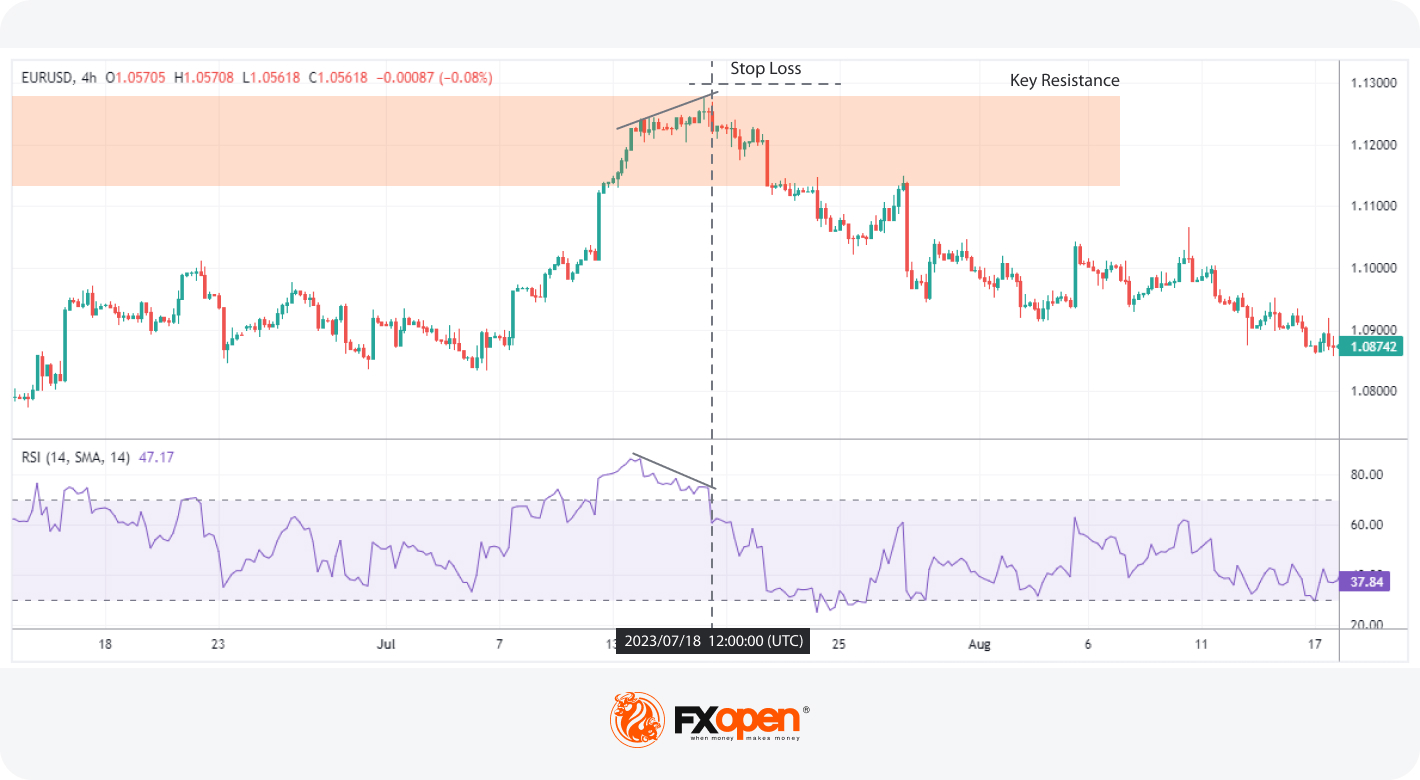
In contrarian trading, strategies are as diverse as they are numerous. However, a commonly employed tactic leverages a combination of RSI readings, key support and resistance levels, and divergences. Here's how this approach often unfolds:
- Identifying Overbought or Oversold Conditions
Traders typically look for assets that are either overbought or oversold, particularly after a long, extended move in one direction. This is where indicators like RSI come into play. An RSI reading above 70—or even more significantly above 80—indicates overbought conditions. Conversely, an RSI below 30—or especially below 20—suggests the asset is oversold.
- Confirming with Support or Resistance Levels
The next step usually involves cross-referencing these RSI levels with key support or resistance points on the chart. An asset's price at these levels can indicate a potential reversal.
- Watching for Divergences
Traders then look for divergences between the asset’s price and the RSI, where the price makes higher highs, and the RSI makes lower highs or vice versa. A divergence can be a strong sign that the current trend is running out of steam and may soon reverse.
- Entry and Exit Points
Entry is often considered when the RSI crosses back above 30 from below or falls back below 70 from above. Stop losses are typically placed above or below the nearby swing point to manage risk. Profits are often considered for taking at another key support or resistance level, thus completing the trade cycle.
The Bottom Line
Contrarian trading offers a unique approach to navigating financial markets, focusing on going against prevailing sentiments to capitalise on market inefficiencies. With the right indicators, principles, and an understanding of market psychology, traders can identify promising opportunities. For those interested in employing these techniques, consider opening an FXOpen account to gain access to hundreds of markets ripe for contrarian trading.
*At FXOpen UK and FXOpen AU, Cryptocurrency CFDs are only available for trading by those clients categorised as Professional clients under FCA Rules and Professional clients under ASIC Rules, respectively. They are not available for trading by Retail clients.
This article represents the opinion of the Companies operating under the FXOpen brand only. It is not to be construed as an offer, solicitation, or recommendation with respect to products and services provided by the Companies operating under the FXOpen brand, nor is it to be considered financial advice.
Stay ahead of the market!
Subscribe now to our mailing list and receive the latest market news and insights delivered directly to your inbox.


Latest articles

NZD/USD Analysis: A Tug-of-War at the Critical Level
The kiwi has strengthened meaningfully against most peers this month. However, against the US dollar specifically, NZD/USD remains well below its 2026 highs, trading in the mid-0.58 area versus January's peak near 0.6075.
New Zealand's Q2 inflation

AUD/USD and USD/CAD React to Rising Geopolitical Risks
Commodity-linked currencies remain under pressure as geopolitical tensions in the Middle East continue to escalate. The United States has maintained strikes on targets in Iran, while the Tehran-backed Houthis have intensified threats to shipping in the Red Sea and near

GBP/CHF: Trendline or RSI — Which One Is Lying?
Sterling enters this week on firmer footing, with political uncertainty fading fast after Andy Burnham's confirmation as Labour leader eased investor concerns over the succession to Keir Starmer. Markets reacted further to reports pointing to Shabana Mahmood as the frontrunner