


What Is the Arnaud Legoux Moving Average?
FXOpen

In the world of trading, identifying trends and making timely decisions is crucial. One tool that has garnered attention for its unique approach to these challenges is the Arnaud Legoux Moving Average (ALMA). This FXOpen article will explore what the ALMA is, how it works, and how traders can effectively use it.
What Is the Arnaud Legoux Moving Average Indicator?
The Arnaud Legoux Moving Average (ALMA) is a technical analysis indicator that offers a fresh take on moving averages. The ALMA, developed by Arnaud Legoux and Dimitris Kouzis-Loukas, aims to mitigate common challenges with traditional moving averages, including smoothing issues and lag.
Why Is an Arnaud Legoux Moving Average Useful for Traders?
The ALMA sets itself apart from other moving averages, like the Simple Moving Average (SMA) or Exponential Moving Average (EMA), by providing smoother trends and reduced lag. Many traditional moving averages tend to lag behind, a drawback that can lead to late entry or exit points. The ALMA addresses this by offsetting the moving average to the right or left, resulting in a better alignment with recent prices. This offers a more accurate reflection of the current market state, giving traders an edge in their decision-making processes.
The ALMA also increases smoothness in trend detection, making it easier for traders to identify the direction of market movement. This is achieved by discarding the equal weighting system commonly used in Simple Moving Averages (SMA) and applying a Gaussian distribution to the data set. As a result, it eliminates irregular fluctuations.
Lastly, the ALMA's versatility is an undeniable benefit. It can be used across various timeframes and applied to different types of assets, including stocks, forex, commodities, and more.
Arnaud Legoux Moving Average Calculation and Formula
The ALMA calculation is quite complex, differing from traditional moving averages. The computation involves three main components: the price data, a window (which represents the number of periods), and the offset (a factor that adjusts the average to the right or left). Here's what the formula looks like:
ALMA = Sum (Wi * Pi) / Sum (Wi)
Here, Wi refers to the weighting applied to each price point (Pi), and it’s determined by the Gaussian function. This weighting decreases as you move away from the centre of the window. The denominator is the sum of the weights applied to each price point.
The key here is the Gaussian function, which is controlled by the window and the offset. The window determines the period over which the ALMA is calculated, and the offset adjusts the average to reduce lag. The standard offset value is set at 0.85, which means 85% of the data is to the left of the maximum point of the Gaussian curve. This results in a faster response to recent price changes. Still, the offset can vary from 0 to 1, where a higher reading will be more responsive and produce more signals, while a lower reading will result in fewer but more reliable signals.
Moreover, the Arnaud Legoux Moving Average standard deviation parameter (σ), or sigma, determines the width of the Gaussian curve, contributing to the smoothness of the indicator. A higher sigma will produce a wider curve and a smoother average.
The optimal Arnaud Legoux Moving Average parameters hinge on an individual's trading style, the asset in question, and the timeframe. While the standard window input is 9 and the offset is 0.85, day traders may prefer shorter windows for faster signals, while swing traders may lean towards longer windows for trend clarity. A higher offset may produce a more responsive but less smooth ALMA and vice versa.
Before trying to calculate the Arnaud Legoux Moving Average in Excel, you’ll be glad to know this calculation is handled automatically by most trading software, including FXOpen’s own TickTrader platform.
How to Trade with the ALMA Indicator
Trend Identification
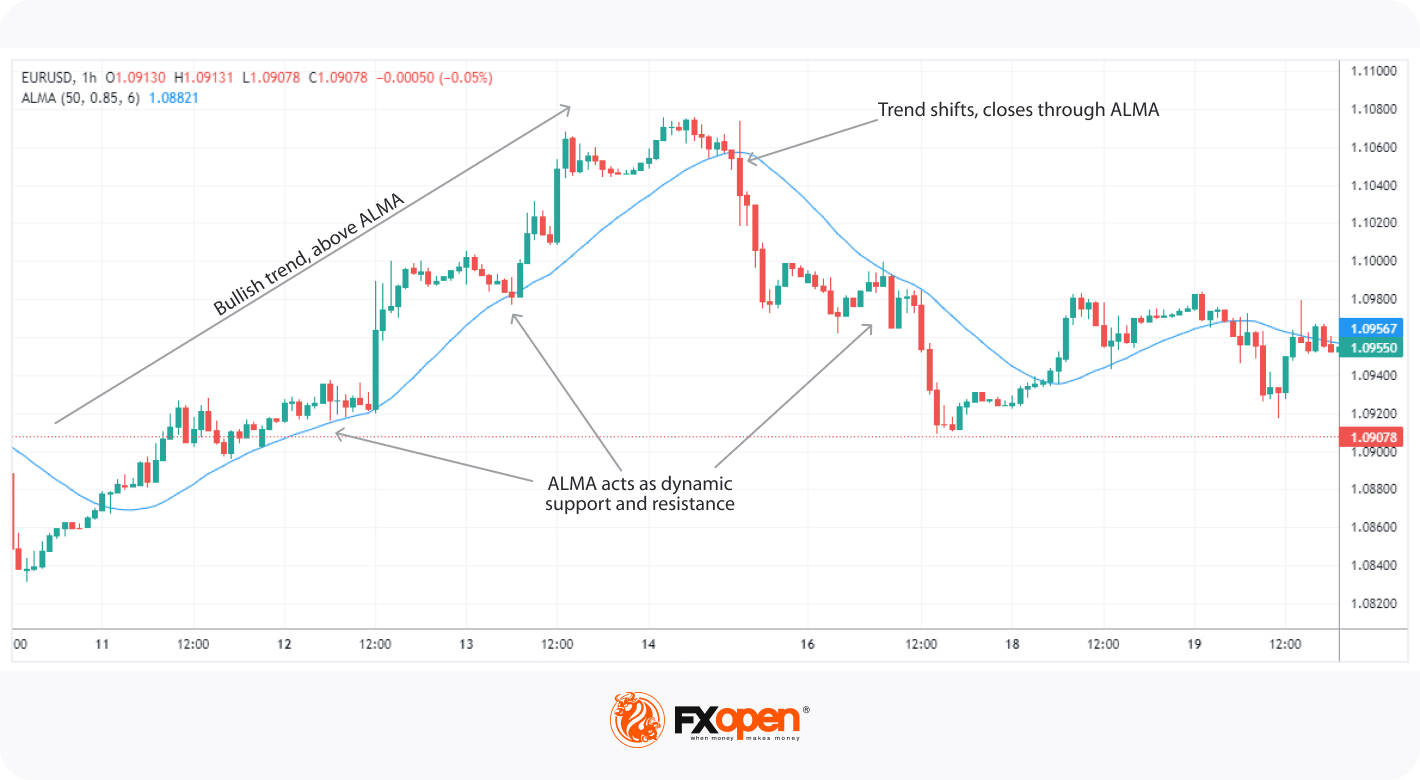
In Arnaud Legoux Moving Average analysis, the indicator is often used to identify the overall direction of the market trend. When the price is above the ALMA line, it generally indicates an uptrend, suggesting it may be an optimal time to consider entering a buy position. Conversely, if the price is below the ALMA line, this typically suggests a downtrend, which may be a good time to go short.
Trend Reversals
Another critical trading strategy involves identifying potential trend reversals. If the price crosses the ALMA line from above, it could signify the beginning of a downtrend, indicating a selling opportunity. If the price crosses the ALMA from below, it might hint at the start of an uptrend, which might be a buying opportunity.
Support and Resistance
The ALMA can also be used to identify potential areas of support and resistance. In an uptrend, the ALMA line can act as a dynamic support level, where the price may bounce off and continue its upward journey. Conversely, in a downtrend, it serves as a dynamic resistance level, potentially causing the price to retreat and continue its downward direction. However, a strong break through these levels may suggest a possible trend change.
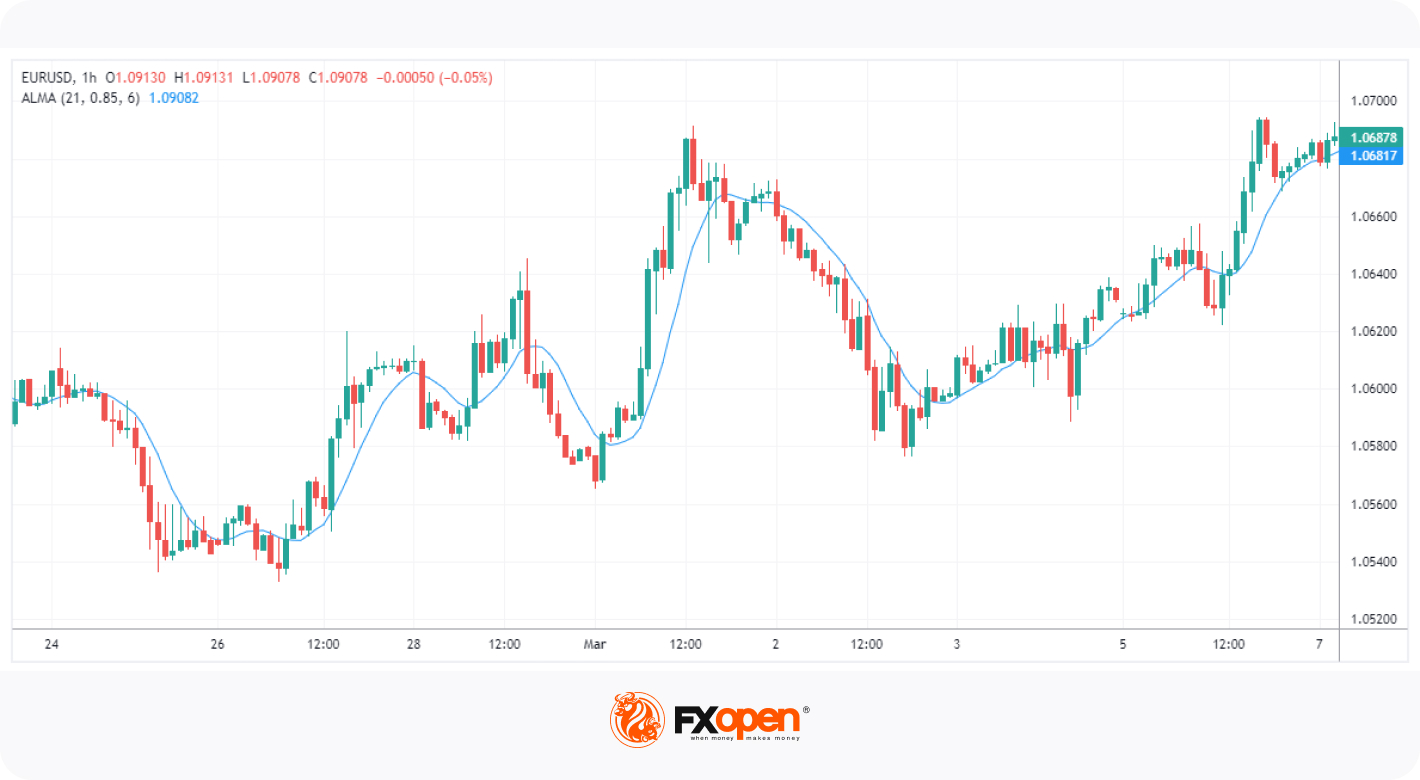
Example of Using the Arnaud Legoux Moving Average vs a Weighted Moving Average

In this EUR/USD chart, the Arnaud Legoux Moving Average (blue) can be seen alongside a Weighted Moving Average (red), both set to a length of 21. The ALMA curve, due to its Gaussian distribution, smoothly tracks price changes with less lag than the WMA. In a price upturn or downturn, the ALMA consistently signals the trend change earlier, giving the trader more time to react.
Limitations of Using Arnaud Legoux Moving Average
While the ALMA offers many advantages, traders should also be aware of its limitations.
One of its primary challenges, like any other moving average, is the potential for generating false signals. There can be instances where the price crosses the ALMA line, indicating a potential trend change, only to reverse soon after. This could lead to premature entries or exits, resulting in potential losses. Using the Arnaud Legoux Moving Average with the MACD indicator can help filter these false signals.
Furthermore, the ALMA's effectiveness may decrease in range-bound or sideways markets. Moving averages tend to work best in trending markets, and the ALMA is no exception. In the absence of a clear trend, the ALMA may produce many whipsaws, leading to multiple unsuccessful trades.
The Bottom Line
In summary, the ALMA is a valuable tool for traders, providing reduced lag and smoother trend detection than other moving averages. While it isn’t foolproof, it can make an excellent addition to your trading toolkit, especially when combined with other indicators. Employing Bollinger Bands while using the Arnaud Legoux Moving Average, for example, can create a complementary system for identifying trend reversals.
With an understanding of its strengths and limitations, you might feel ready to put your newfound knowledge into practice. If so, you can open an FXOpen account to apply the ALMA across 600+ markets inside of our advanced TickTrader platform. Good luck!
This article represents the opinion of the Companies operating under the FXOpen brand only. It is not to be construed as an offer, solicitation, or recommendation with respect to products and services provided by the Companies operating under the FXOpen brand, nor is it to be considered financial advice.
Stay ahead of the market!
Subscribe now to our mailing list and receive the latest market news and insights delivered directly to your inbox.


Latest articles

Gold Analysis: Is the Correction Over, or Just Catching Its Breath?
Gold has had a rough year. After hitting an all-time high near $5,602 in January, the metal has since dropped roughly 27% from that peak, weighed down by rising Treasury yields, a firmer dollar, and cooling demand for safe-haven

Brent Analysis: Oil Retreats from $100 as Saudi Arabia Proposes Maritime Coalition Initiative
On 23 July 2026, Brent crude rose above $100 amid reports of attacks on tankers and infrastructure in the Red Sea area, as well as strong statements from Donald Trump towards Iran over threats to shipping security through the Strait

Nasdaq 100: 48 Hours of Chaos, One Trendline Standing in the Way
Wall Street just lived through one of its wildest 48 hours of the year. On Wednesday, the Fed held rates steady at 3.50%-3.75%, but three FOMC members broke ranks to demand a hike—an unusually hawkish dissent