


Williams Alligator Strategies
FXOpen
The Bill Williams Alligator indicator has become a mainstay in many traders’ toolkits. Utilising three moving averages to create the Alligator’s jaws, teeth, and lips, it provides deep insight into trends and potential reversals. This article breaks down the Alligator, offering three comprehensive strategies to leverage it effectively.
Understanding the Bill Williams Alligator
The Alligator, a Bill Williams indicator, is a powerful tool in financial trading, offering insights into market trends and potential turning points. Conceptualised by renowned trader Bill Williams, the Alligator is grounded in the notion that markets move in a rhythmic pattern, akin to the predatory behaviour of an alligator.
This indicator employs three smoothed moving averages, each named after parts of an alligator: the 'Jaw' (13-period), 'Teeth' (8-period), and 'Lips' (5-period). These moving averages are displaced into the future, adding a dynamic and predictive element to the analysis.
How to Use the Williams Alligator
Using the Williams Alligator involves interpreting the interplay of its three smoothed moving averages: Jaw, Teeth, and Lips. When these lines overlap, the Alligator is 'sleeping', indicating a flat, directionless market. Traders typically view this as a time for caution, avoiding new positions due to the lack of clear trends.
As the market wakes up, the lines start to separate. The Alligator 'awakening' is often a precursor to a new trend. A widening gap between the Jaw, Teeth, and Lips suggests a strengthening trend. Traders look for this divergence as an opportunity to align with the new trend direction.
However, once the lines start converging again, it signals that the Alligator is 'sated', and the current trend may be nearing its end. This convergence serves as a cue for traders to consider exiting positions or tightening stop-loss orders to protect potential profits.
Note: It's crucial for traders to combine the Alligator's signals with other analysis methods to validate these trends and refine entry and exit strategies.
Now, we’ll move on to three Alligator strategies. To gain the best understanding, consider following along in FXOpen’s free TickTrader platform.
Alligator Awakening Strategy
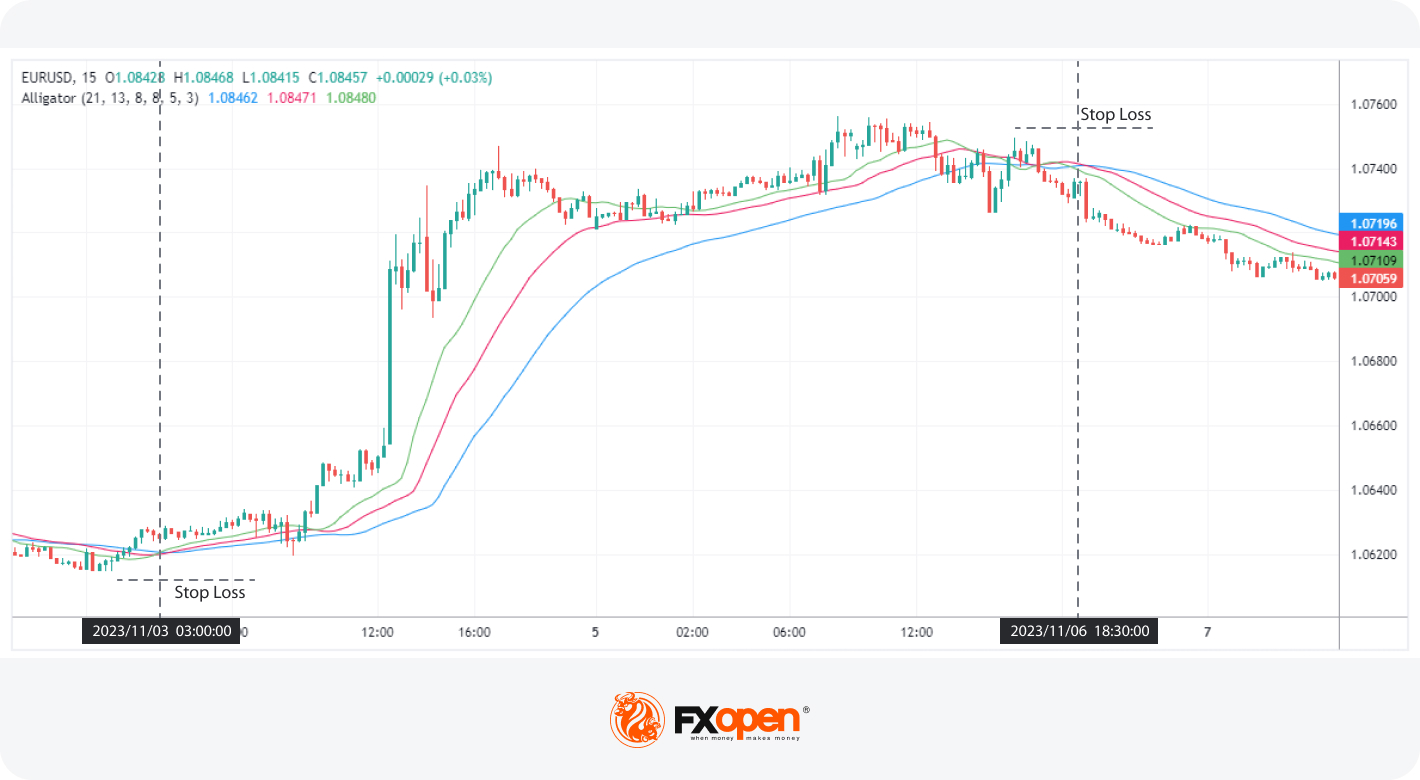
The Alligator Awakening strategy capitalises on the transitional phase of the Alligator from a 'sleeping' to an 'awakening' state. This shift is marked by the separation of the Alligator's lines after a period of being closely intertwined, signalling a potential trend emergence.
Entry
- Traders can consider a buy position when the green line (Lips) crosses above both the red (Teeth) and blue (Jaw) lines, indicating an upward trend.
- Conversely, a sell position may be considered when the green line crosses below the red and blue lines, suggesting a downward trend.
Stop Loss
- Traders often set the stop loss beyond a nearby swing point. This placement helps mitigate risk if the anticipated trend reversal does not materialise.
Take Profit
- The strategy considers closing the position when the Alligator's lines start reconverging, indicating the end of the 'awakening' phase and a return to a 'sleeping' state, where no clear trend is present.
Fractal Alligator Strategy
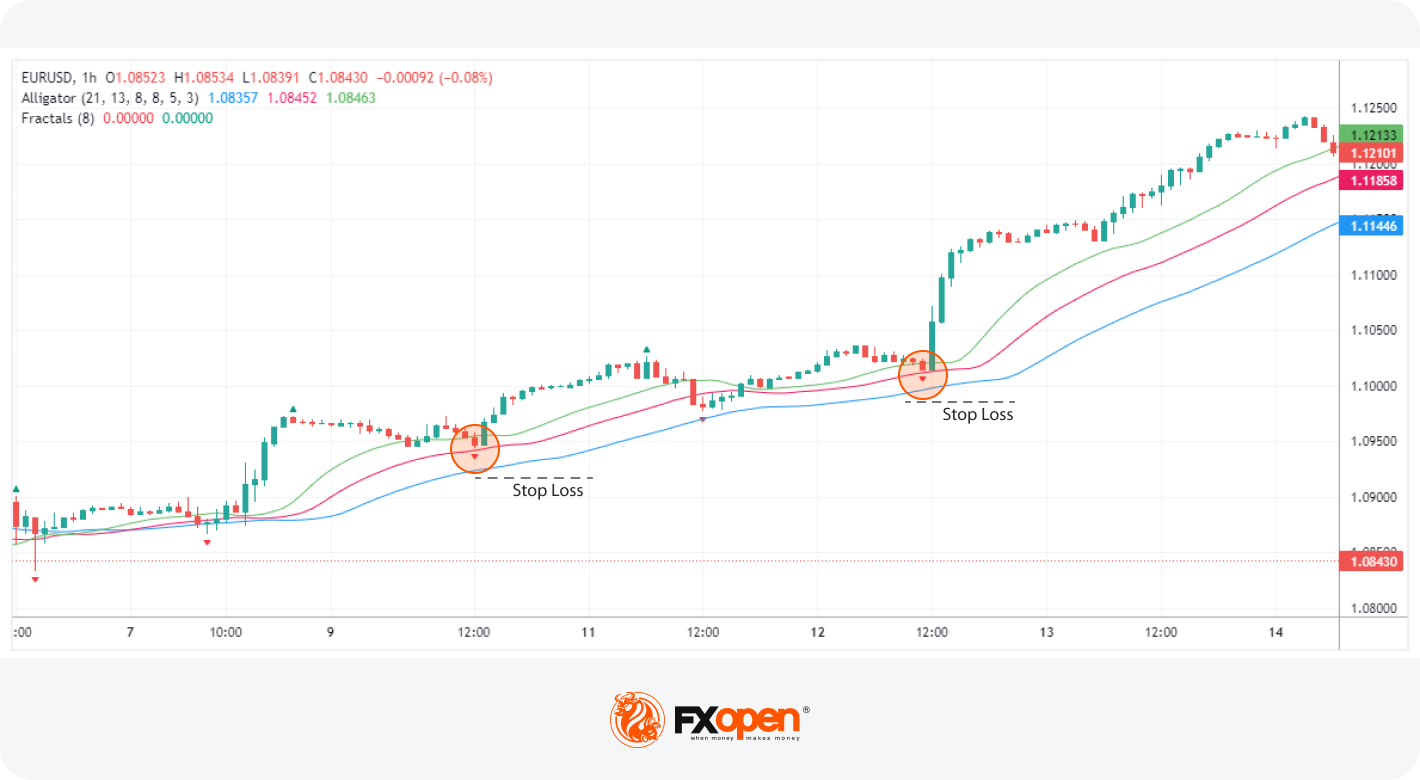
The Fractal Alligator strategy forms a well-rounded Williams Alligator system for trading. It combines the Alligator with the Williams Fractal indicator, set to 8 periods. This approach leverages the strengths of both indicators to pinpoint potential market entry points with greater precision.
Entry
- Traders combine the Alligator with Fractals for entry signals. A buy position is considered when a bullish fractal forms above the Alligator’s Teeth (red line). This indicates potential upward momentum.
- Conversely, a sell position is contemplated when a bearish fractal is observed below the Teeth, suggesting downward movement.
Stop Loss
- The stop loss is strategically placed either beyond a nearby swing point or beyond the Alligator’s Jaw (blue line). This placement aims to balance risk management with the potential for effective trades.
Take Profit
- Profit-taking is initiated when the Lips (green line) or both the Lips and the Teeth cross the Jaw. This crossover often signals a shift in market direction or a loss of momentum, making it a prudent point to secure gains.
Alligator + RSI Confirmation Strategy
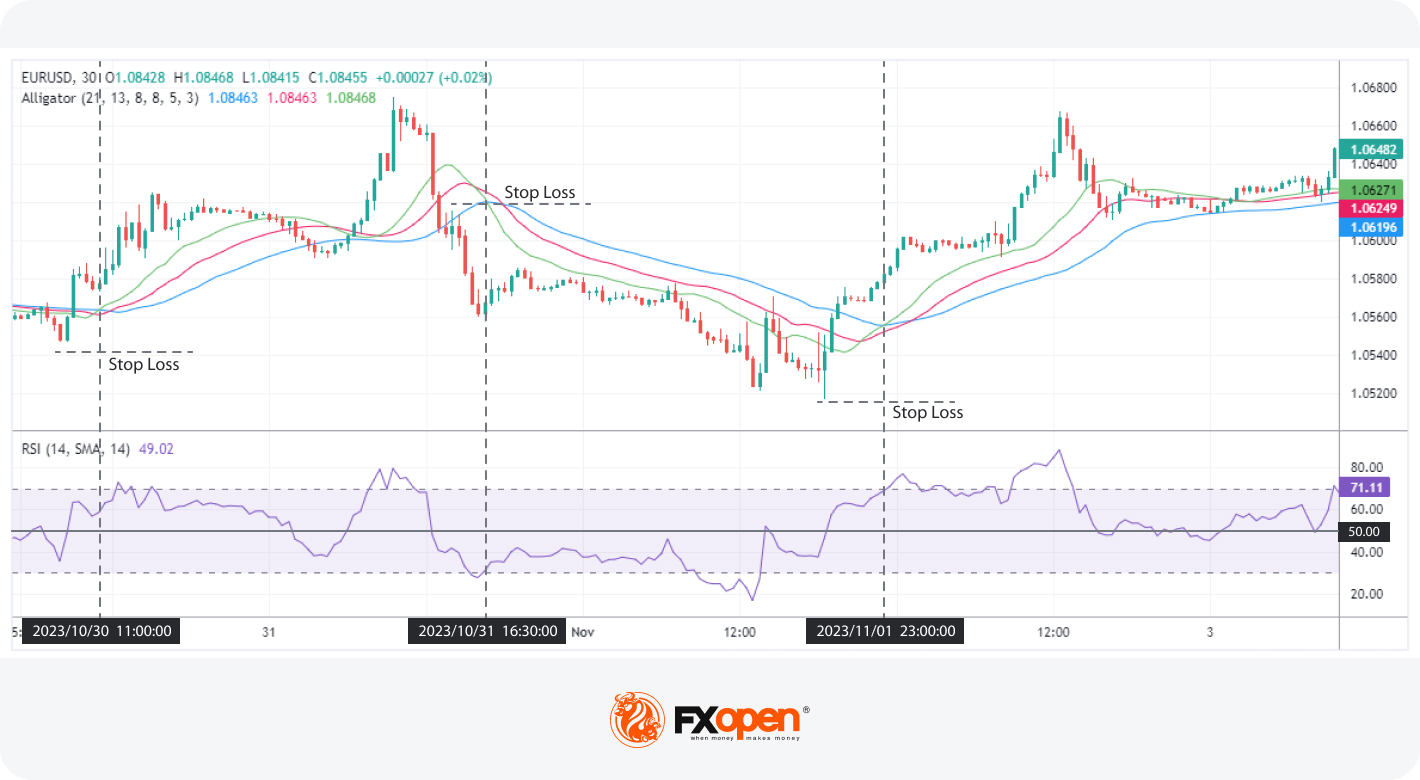
The Alligator + RSI Confirmation strategy is a refined version of the Alligator Awakening, incorporating the Relative Strength Index (RSI) to bolster trend confirmation. This method combines the predictive nature of the Alligator with the RSI’s trend strength assessment.
Entry
- Traders watch for the Lips (green line) to cross over both the Teeth (red line) and the Jaw (blue line) or for the green and red lines to cross over the blue line.
- The RSI plays a crucial role in this strategy. For a bullish entry, the RSI should be above 50, indicating upward momentum. For a bearish entry, the RSI should be below 50, suggesting downward momentum.
Stop Loss
- A stop loss is set just beyond a nearby swing point. This measure aims to minimise potential losses in case the market moves against the trade.
Take Profit
- Profits are considered when the Alligator’s lines begin to converge back into a 'sleeping' state. This convergence signals a potential end or pause in the trend, making it an opportune moment for taking profits.
The Bottom Line
In conclusion, the Bill Williams Alligator strategy provides a comprehensive framework for understanding market trends. By mastering its principles, traders can enhance their decision-making process. To practically implement these strategies and explore their benefits, consider opening an FXOpen account. Once you do, you’ll gain access to hundreds of markets and the ideal trading conditions to use the Alligator. Good luck!
This article represents the opinion of the Companies operating under the FXOpen brand only. It is not to be construed as an offer, solicitation, or recommendation with respect to products and services provided by the Companies operating under the FXOpen brand, nor is it to be considered financial advice.
Stay ahead of the market!
Subscribe now to our mailing list and receive the latest market news and insights delivered directly to your inbox.


Latest articles

Amazon Earnings: Does the Chart Already Know Something the Numbers Don't?
All eyes are on July 30, when Amazon reports Q2 2026 earnings, with Wall Street increasingly convinced the bar has been set too low. Consensus sees EPS near $1.82-$2.26 on roughly $197 billion in revenue, but the

WTI Analysis: Gap Breaks Short-Term Trend as Price Remains Trapped Between the POC and Profile Boundary
WTI crude oil plunged by more than 7% on 27 July 2026 after the US suspended a series of strikes against Iran over the weekend, raising hopes of a diplomatic solution and the reopening of shipping through the Strait of

US Dollar Index: A Defining Week for the King of the Markets
The dollar heads into a pivotal week trading near 101.80, just off a 15-month high, with the Fed's July 29 meeting standing as the clear focal point. Markets currently price roughly a 65% chance of a hold, though renewed