


FXOpen
A price can be ascending or descending thus, moving in a zig zag. Also, we know that a start of a wave will determine a trend that will consolidate or not depending on a risk aversion.
By drawing any two points we have a simple segment. We can see small movements between AB or CD or even DE that can possibly form new patterns.

For example, we know that the curve is moving down on the strech between the points (A) and (B). So, you can draw points {1, 2, 3,…, N} in order to make clear that our direction persists going down, that's a bearish force. I am talking about swings, ups or downs in a simple curve.
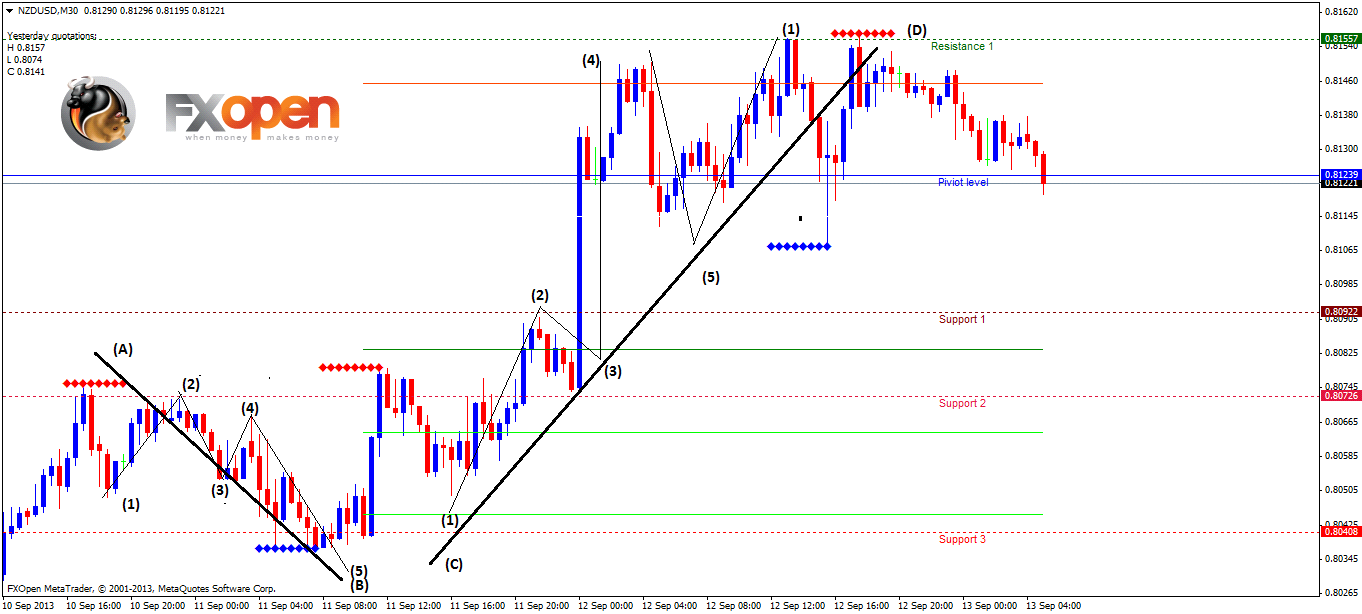
It would be easy to trade Forex if we know every point and the begging of a curve with lower and higher concavity beforehand. The problem is: we don't know! Really, we aren't an oracle, we just trade in accordance with what we see.
If a price behaves only in a simple range as described in the picture above, anyone would have a higher probability of making a great setup. We shall consider the nature of random in economy before analyzing a zig zag theory. Breakouts happen all the time, and you should be clever enough to detect them. In a way breakouts represent how irregular the market is. They translate how fear or greedy investors or players are.
Another observation is based on the importance of fundamental news. Due to loads of information received by traders, any instrument either a currency or futures may become a subject of a trading fever. In other words, when there is too much speculation about Monetary Easing, to taper or not to taper, it generates a lot of tension on the market. If FED talks in to taper the baby QE, what do you believe traders should think? Well, personally, I would sell US treasuries, right? Okay. What happens is the following: we DON'T know what FED will do at their next meeting. If you can see a largest drop on XAU/USD a day before FOMC, don't worry about it. This could mean the following to us: "Sell on rumors, Buy in fact." On the opposite side, if you see a largest rise, this can represent a following statement: "Buy on rumors, Sell in fact." This occurs because the market is getting ready to receive an impact after the news release that scares newbies.
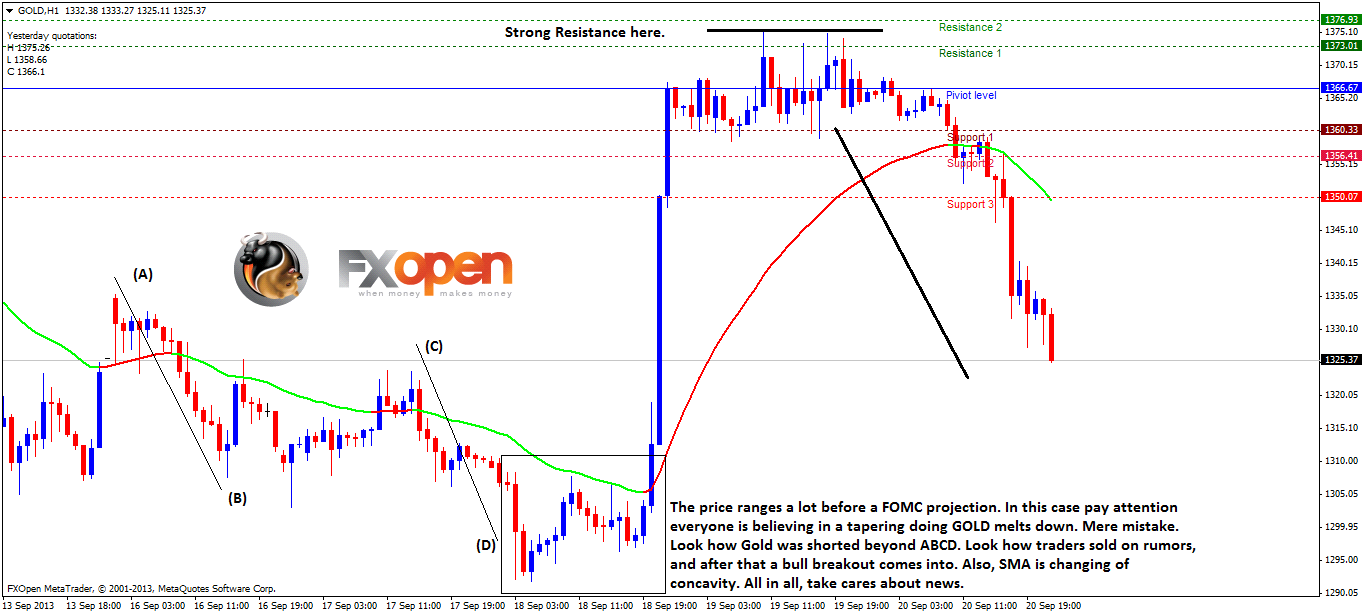
XAUUSD is an illustration: In the beginning of the week the price was opened with the Gap Up. This occurs because we want to continue buying, doesn’t it? Not exactly, actually.
Look at the above discussed (AB) wave. (A) point is showing you that any rise is under pressure. It’s true, after the first wave and the first (B) signal, an earlier confirmation comes after Tuesday, a new (CD) pattern confirms more drops. On FOMC Wednesday, the numbers are ranging when finally a breakout sends a new trend confirmation.
It’s important to note that this is only one possibility among too many arrangements.
Discussing further, traders should always notice patterns as Head and Shoulders. But what is this? Head represents a peak or solid resistance. Shoulders are curves drawn below the peak. Imagining a body, we have a Head and two Shoulders. For example, when there is an H&S pointing up, it is very common to see prices melting down.
EURUSD is an example.

Mhm, the cat is smiling because it has found a nice harmonic XABC.
Usually, you can see an H&S.

All in all, we have seen an introduction of how curves are important for traders. One segment is designed by swings {1,2,3,…,N} when finally a new curve becomes in "N." A curve 2 will be N,N+1. A curve 3 will be N+1,N+2 and so on.
An H&S pattern is very interesting when taking clear signals. Be sure to stop by looking at charts in 5M, 30M,1H, etc.
So, economic data might be relevant indicating the volatility within a day, a week or even a month. Depending on news we can see the craziest curves with anormal swings. But the market is always resilient.
The article is written by Igor Titara and is participating in the Forex Article Contest. Good luck!
This article represents the opinion of the Companies operating under the FXOpen brand only. It is not to be construed as an offer, solicitation, or recommendation with respect to products and services provided by the Companies operating under the FXOpen brand, nor is it to be considered financial advice.
Stay ahead of the market!
Subscribe now to our mailing list and receive the latest market news and insights delivered directly to your inbox.

Latest articles

Weekly Market Wrap With Gary Thomson: Nasdaq, EUR/USD, USD/CHF, Brent Crude Oil, Googl Shares
Get the latest scoop on the week's hottest headlines, all in one convenient video. Join Gary Thomson, the COO of FXOpen UK, as he breaks down the most significant news reports and shares his expert insights.
- Nasdaq Composite: Worst Session

Analysis of AUD/USD: Exchange Rate Falls to Early May Low
As indicated by the 4-hour AUD/USD chart today:
→ the rate fell below 0.652, a level last seen on May 2;
→ the RSI indicator dropped below 15, a level last seen during the panic over the spread of COVID-19

Analysis of AMZN Stock: Price at 1.5-Month Low
As shown in the AMZN chart, the stock price dropped below:
→ the psychological level of $180;
→ the mid-June interim low.
The last time AMZN traded below $180 was in early June.
Thus, AMZN has faced sell-offs, similar to other tech