


1-2-3 Pattern
FXOpen
Veterans of the foreign exchange market know that currency prices move in a zig zag way representing the the bear-vs-bulls force. Everything that really matters here is the price action. Let’s try to understand the market analysing candle by candle. It’s important to say that candles express the power of a new wave. So, if you watch out a long red candle the price is telling you that bears are coming.
Market is moved by three psychological principals: Greed – Fear – Hope.

Notice that big financial institutions are big players making futures or currencies get a new destination.
Market prices usually start from a lower level with a limited volume. The price changes according to the traded volume requirements as there are always sellers in the demand zone and bidders in the supply zone making an equilibrium on monetary trading system.
The price reaches its peak and then bursts like a babble. Sounds interesting, but after a peak mini bubbles create a new order in economy.
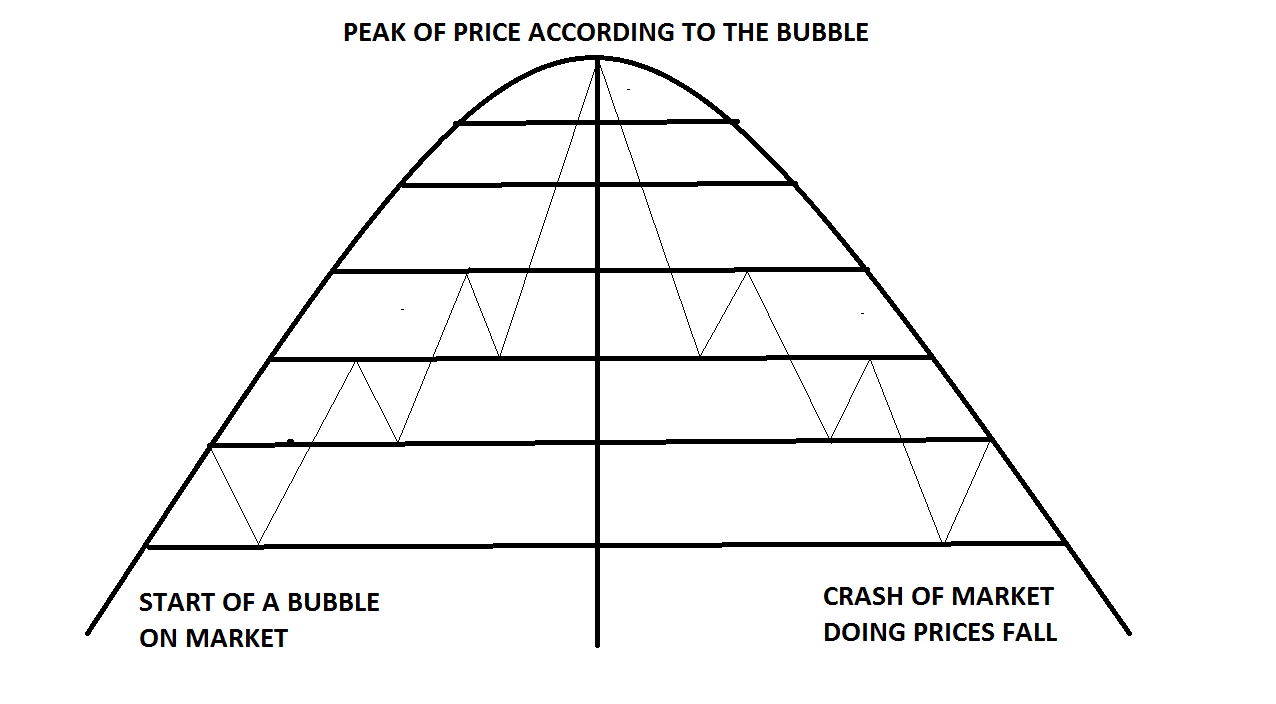
For better understanding have a look at the picture above. Remember that it is not about a forecast but an explanation of such curves.
Look at the patterns. All of them seem interesting.
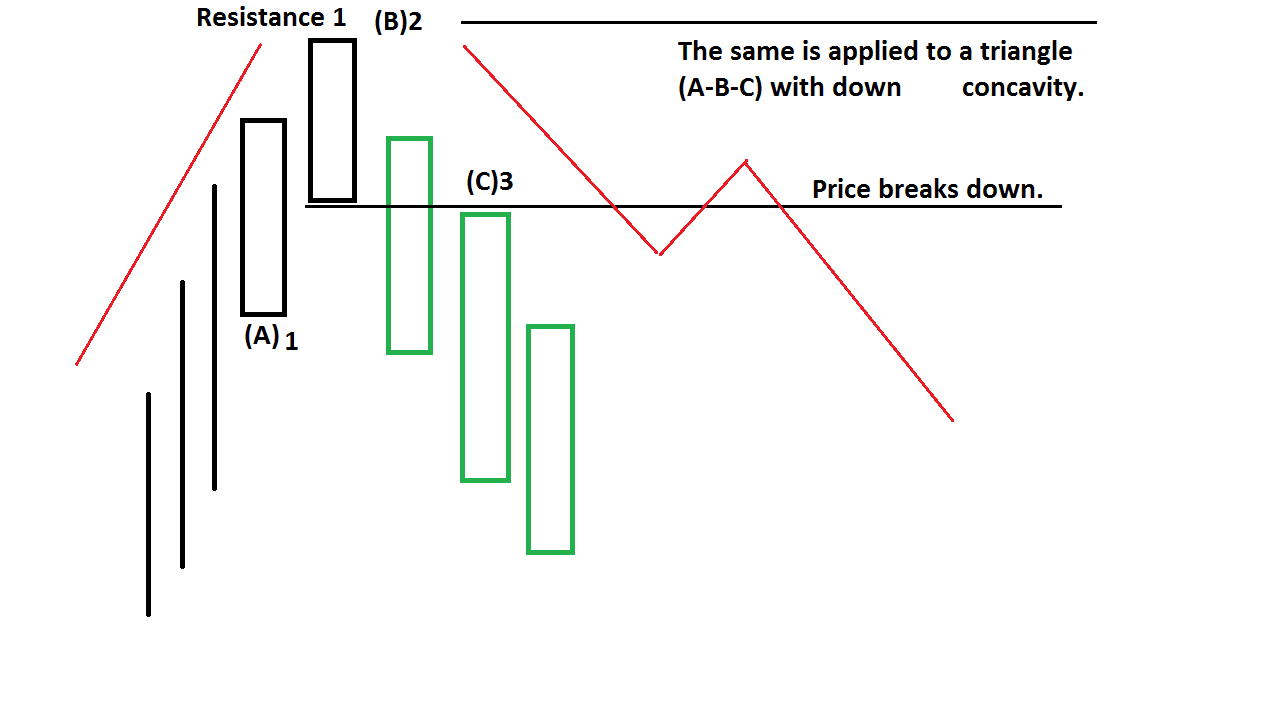
Starting with 1-2-3 pattern a good trend can be revealed.
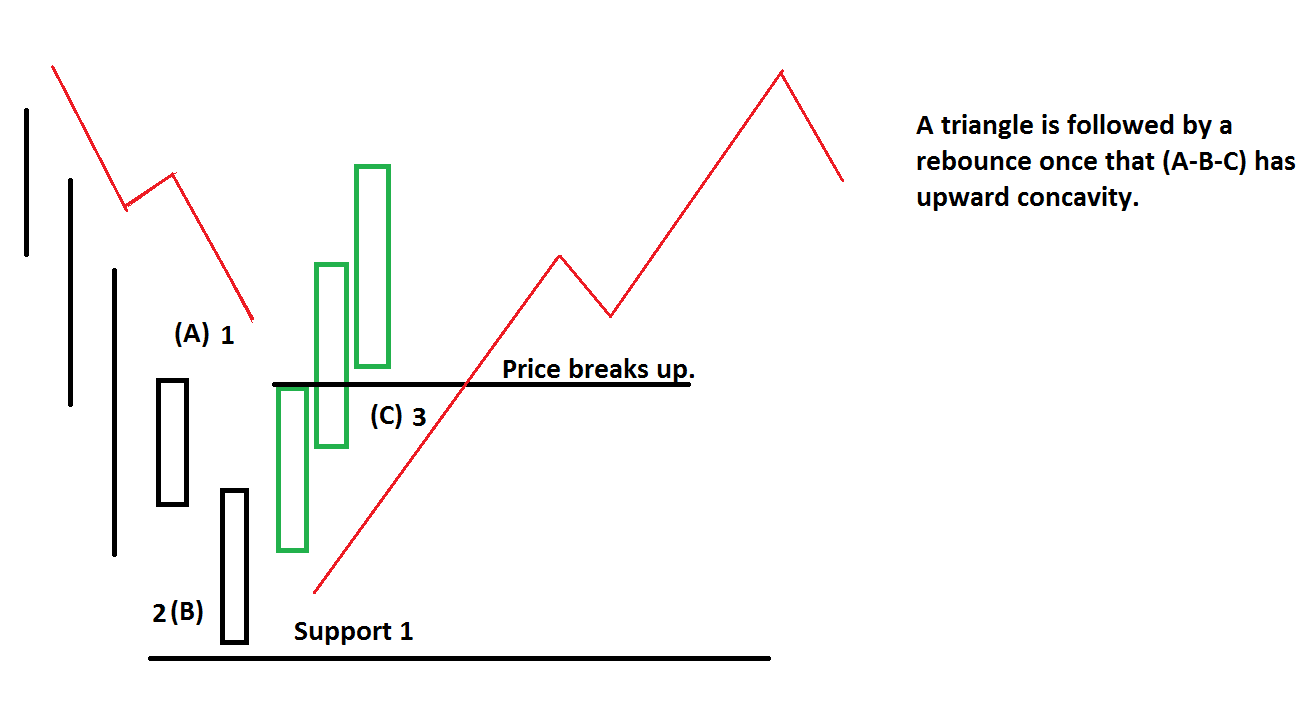
If you draw three numbers in different points of a curve you will get a small triangle – a triangle pointing down or up.
Example 1: AUDUSD
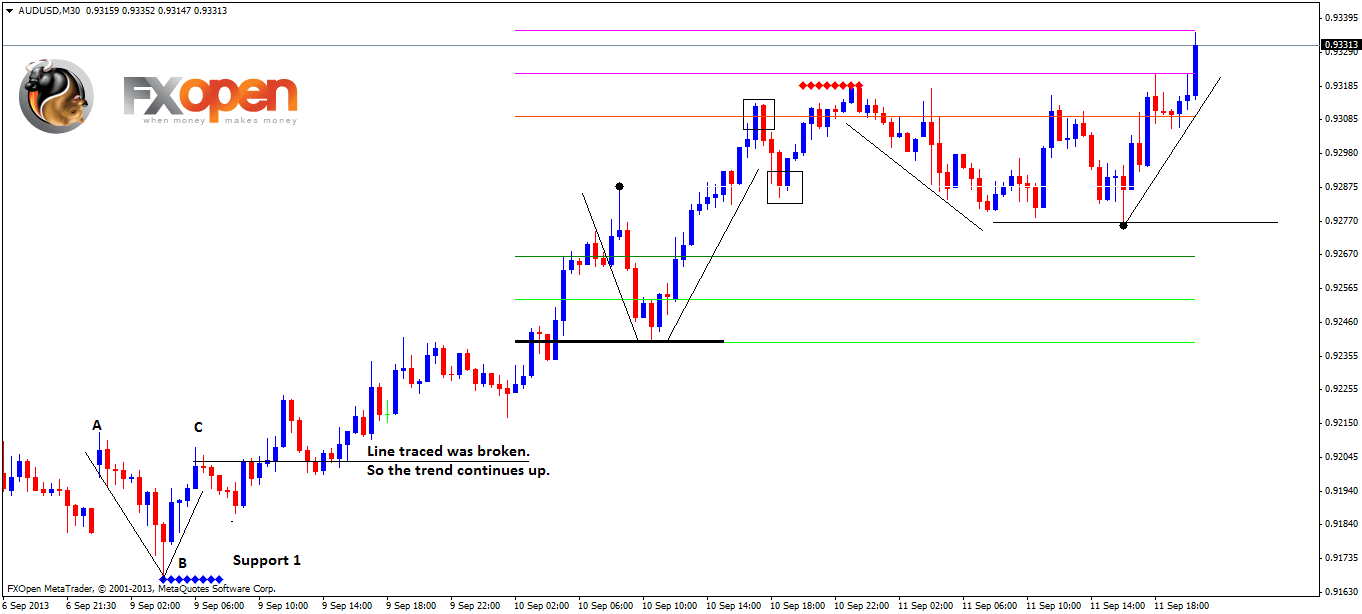
On Sunday the AUDUSD price was opened in a gap up demonstrating that there is some force provoked by buyers or investors. Gaps are interesting in their way as they tell you a dominant wave. The Gap Up represents an upside clean window. The Gap Down represents a downside clean window.
How to Draw ABC Pattern
Put a point (A) on the first candle formed and draw a second point (B) on the first support created. We have a wave AB with a down direction, right? Yes, notice that a blue candle is coming as a bullish reversal.
It is not an obligation to think that the first wave is dominant. In this case, we will draw a point (C) since that the second wave must be a bit lower than the first wave. When the price breaks a resistance there is a strong probability of an upward movement.
When the price breaks a support the next (CD) wave will continue moving down. This is caused by a price action.
All in all, AB, BC, CD form a triangle and as we said before if a small ABC creates a stronger support we have all grounds to believe in a bullish walk. If a small ABC creates a stronger resistance we have all grounds to believe in a bearish walk. It’s easy and simple.
Example 2: USDJPY

SMA – Simple moving Average describes how far the price can move.
If and only if there are blue candles above the SMA curve we can set a buy order. Remember that a price reversal is common. The reversal can indicate new supply and demand zones. In this case, look at the point (A) and CCI (24) sync. They represent a new bullish engulfing pattern. A bull trader can go long.
Look: AB (UP), BC (Down) is a correction, CD (UP) again. Note that the line was broken and the trend keeps being favorable for bulls.
Example 3: GBPJPY

In this chart lets explore a concept of MACD – Moving Average Convergence/Divergence. For MACD > 0 traders tend to open long orders making an upward variation AB. There is a common BC correction and then CD price variation. What is the conclusion? ABCD pattern was created in a bullish engulfing pattern and MACD takes a bull divergence. For a MACD < 0 we can consider a bearish divergence.
An abstract overview:
 istance Support and Resistance that you must indentify. CCI and Stochs are useful to do that.
Look at the opposite:
When candles are exhausted by themselves a new engulfing pattern is probably under formation. That’s the meaning of the ABC triangle: to describe a move or a trend depending on the size of AB,BC,CD.
This article represents the opinion of the Companies operating under the FXOpen brand only. It is not to be construed as an offer, solicitation, or recommendation with respect to products and services provided by the Companies operating under the FXOpen brand, nor is it to be considered financial advice.
Stay ahead of the market!
Subscribe now to our mailing list and receive the latest market news and insights delivered directly to your inbox.

Latest articles

EUR/USD Eyes Gains As USD/CHF Weakness Deepens Again
EUR/USD started a fresh increase above 1.1700 and 1.1720. USD/CHF declined further and is now struggling below 0.7835.
Important Takeaways for EUR/USD and USD/CHF Analysis Today
· The Euro started a decent increase from

Apple: Earnings Day Above the Activity Zone
On 30 April, after the market close, Apple Inc. will release its financial results for the second quarter of fiscal 2026. The consensus forecast, based on estimates from 31 analysts, points to revenue of around $109.7 billion, with expected

USD/JPY and USD/CHF Near Key Levels: The Dollar Supported by the Fed
The US dollar continues to trend upwards following the Federal Reserve meeting, drawing support from the regulator’s moderately hawkish stance and comments by Jerome Powell. Markets interpret the Fed’s rhetoric as a signal that restrictive policy is likely