


Market Analysis: Gold Price and Crude Oil Price Face Key Hurdles
FXOpen

Gold price is struggling to gain momentum above the $2,003 resistance. Crude oil price is consolidating losses and struggling to recover above $75.20.
Important Takeaways for Gold and Oil
· Gold price seems to be trading in a range below the $2,010 resistance against the US Dollar.
· A key bullish trend line is forming with support near $1,982 on the hourly chart of gold at FXOpen.
· Crude oil prices declined heavily below the $79.00 and $76.50 support levels.
· There is a major bearish trend line forming with resistance near $75.20 on the hourly chart of XTI/USD at FXOpen.
Gold Price Technical Analysis
On the hourly chart of Gold at FXOpen, the price formed a base above the $1,976 support zone. The price started a decent increase and was able to clear the $2,003 resistance zone.
However, the bears were active near the $2,010 resistance. There were more than two attempts to clear the $2,010 resistance but the bulls failed. It reacted to the downside and retested the $1,976 support.
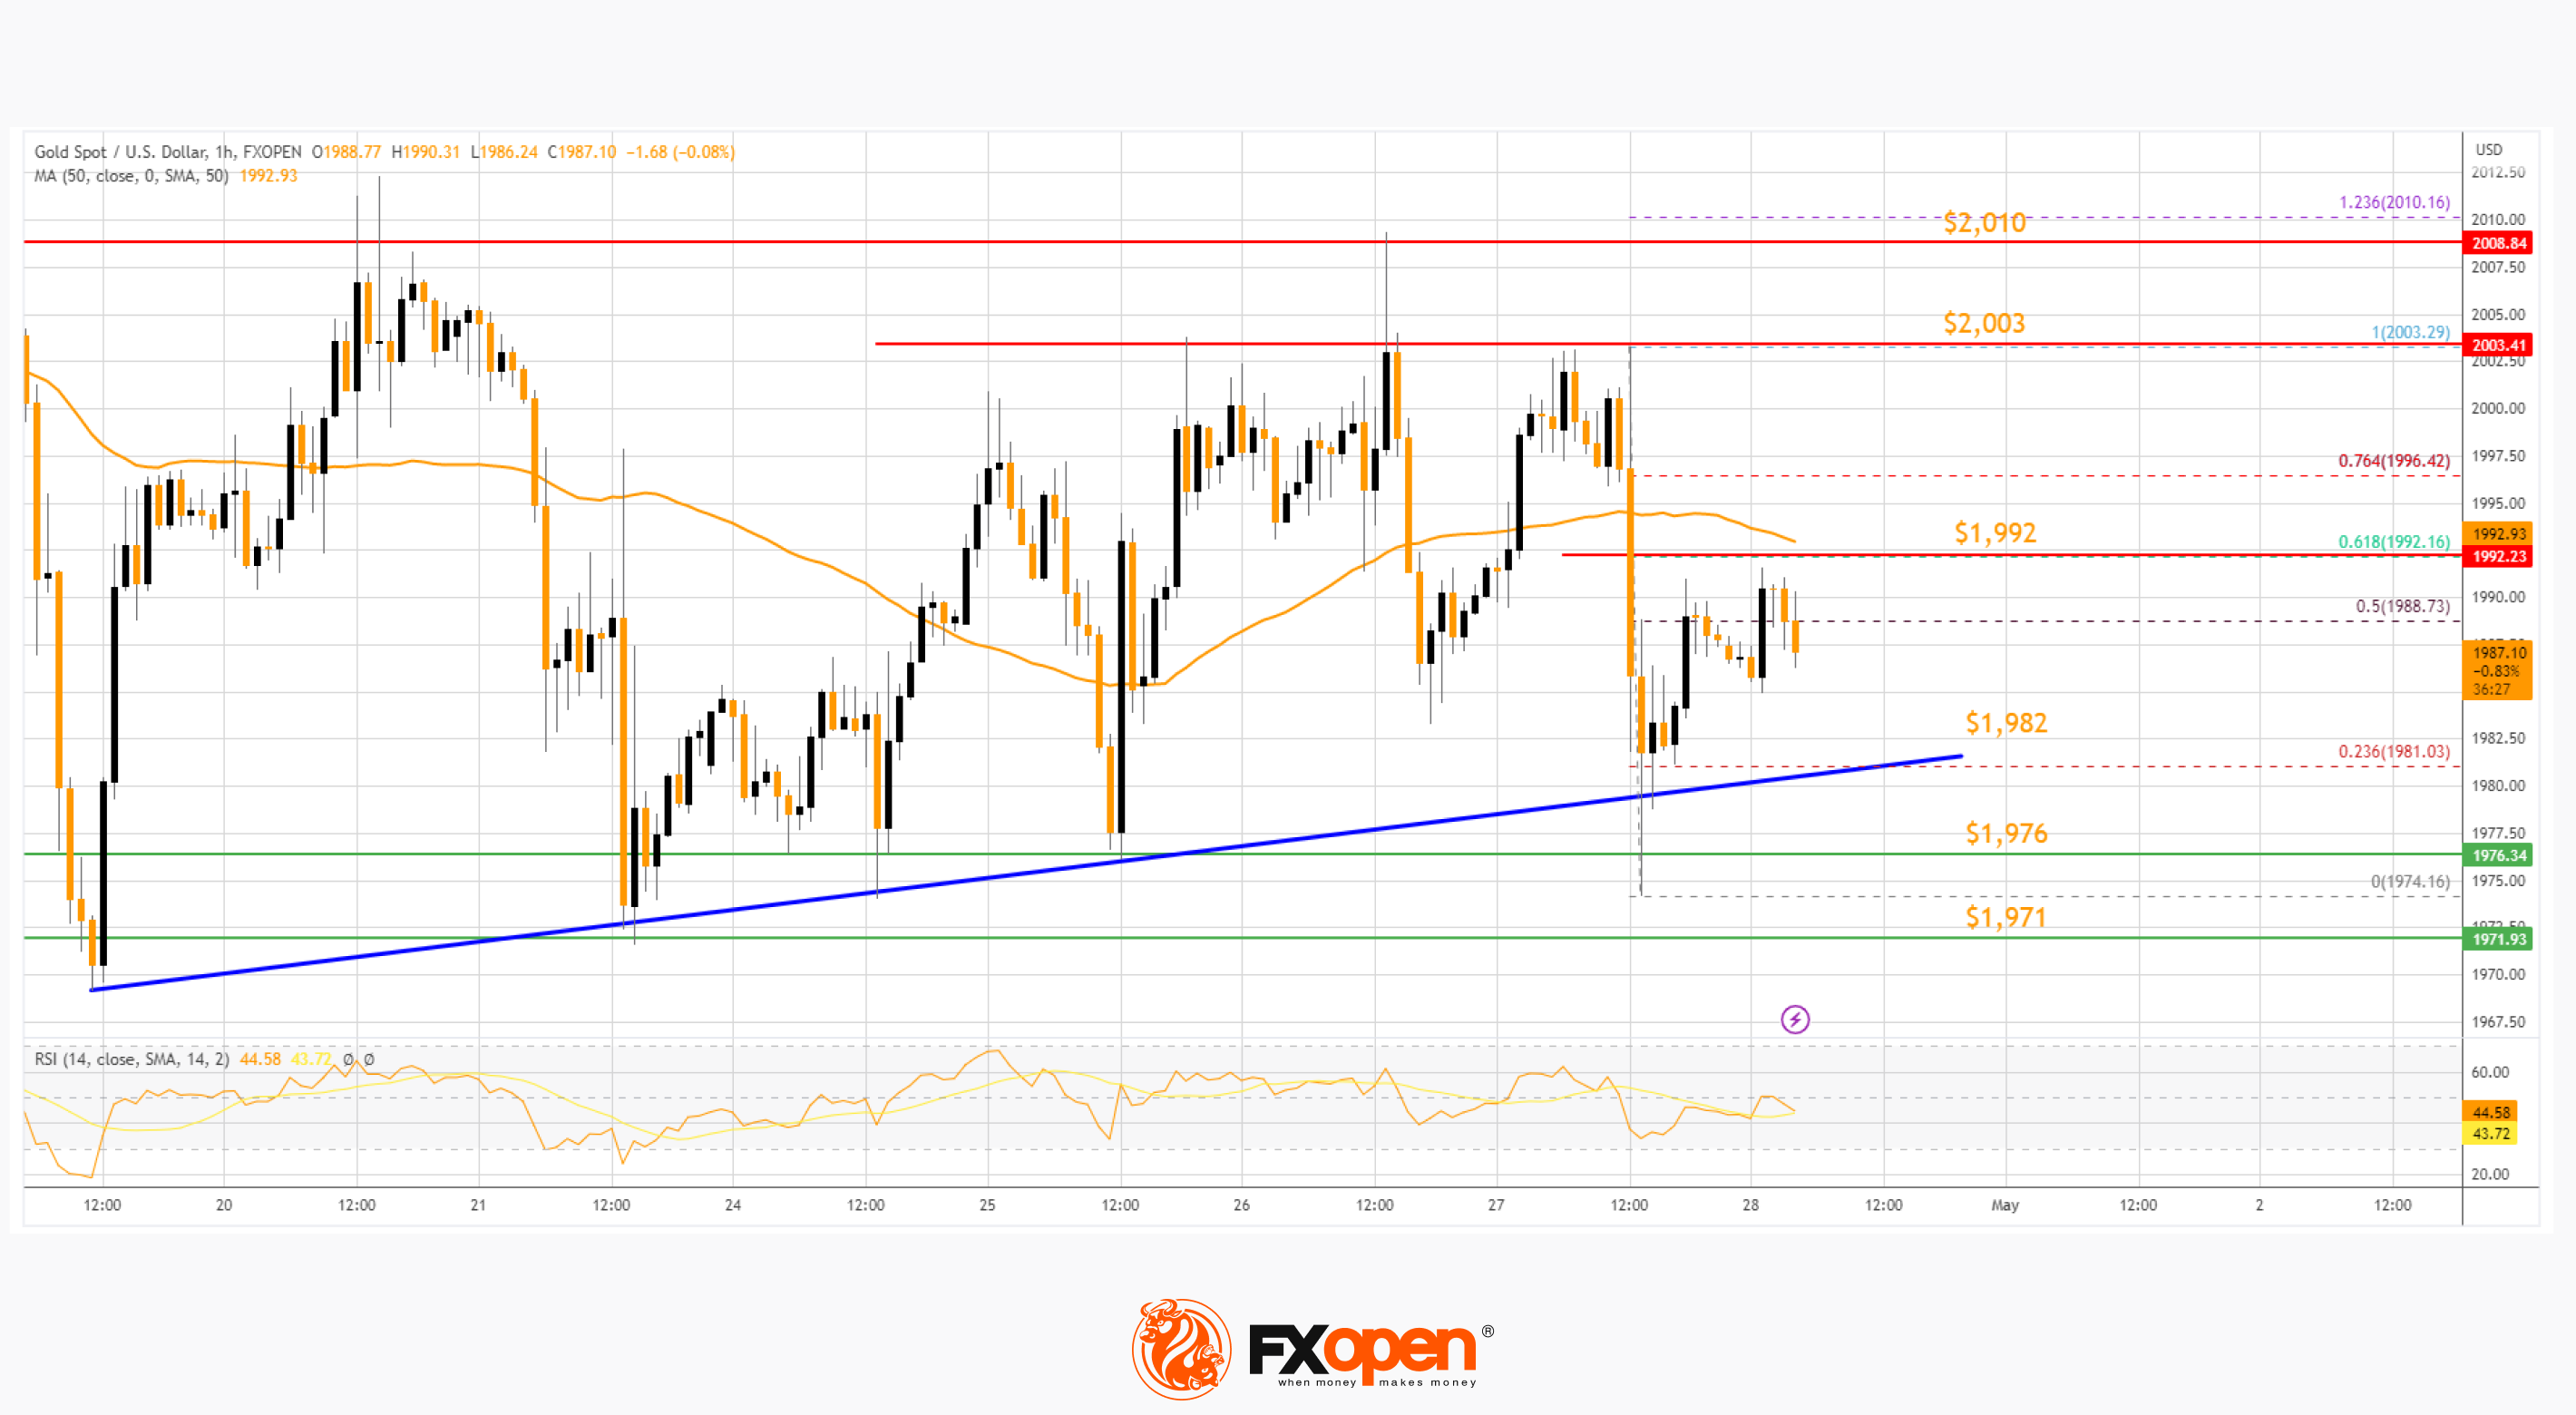
The price is now rising and trading near the 50% Fib retracement level of the recent decline from the $2,003 swing high to the $1,974 low. Initial support on the downside is near a key bullish trend line at $1,982.
The first major support is near the $1,976 level. The main support sits near the $1,971 level. If there is a downside break below the $1,971 support, the price might decline heavily.
The next major support is near $1,960, below which the bulls could aim for a test of $1,950. On the upside, the bulls are facing resistance near the 50-hour simple moving average at $1,992. It coincides with the 61.8% Fib retracement level of the recent decline from the $2,003 swing high to the $1,974 low.
An upside break above the $1,992 resistance could send the price toward $2,003. Any more gains may perhaps set the pace for an increase toward the $2,010 level.
Oil Price Technical Analysis
On the hourly chart of Crude Oil at FXOpen, the price started a fresh decline from well above $80.00 against the US Dollar. The price declined heavily below the $76.50 support zone.
Finally, it tested the $74.00 support zone. A low is formed near $74.00 and the price is now attempting a recovery wave. It is testing the 23.6% Fib retracement level of the downward move from the $79.00 swing high to the $74.00 low.
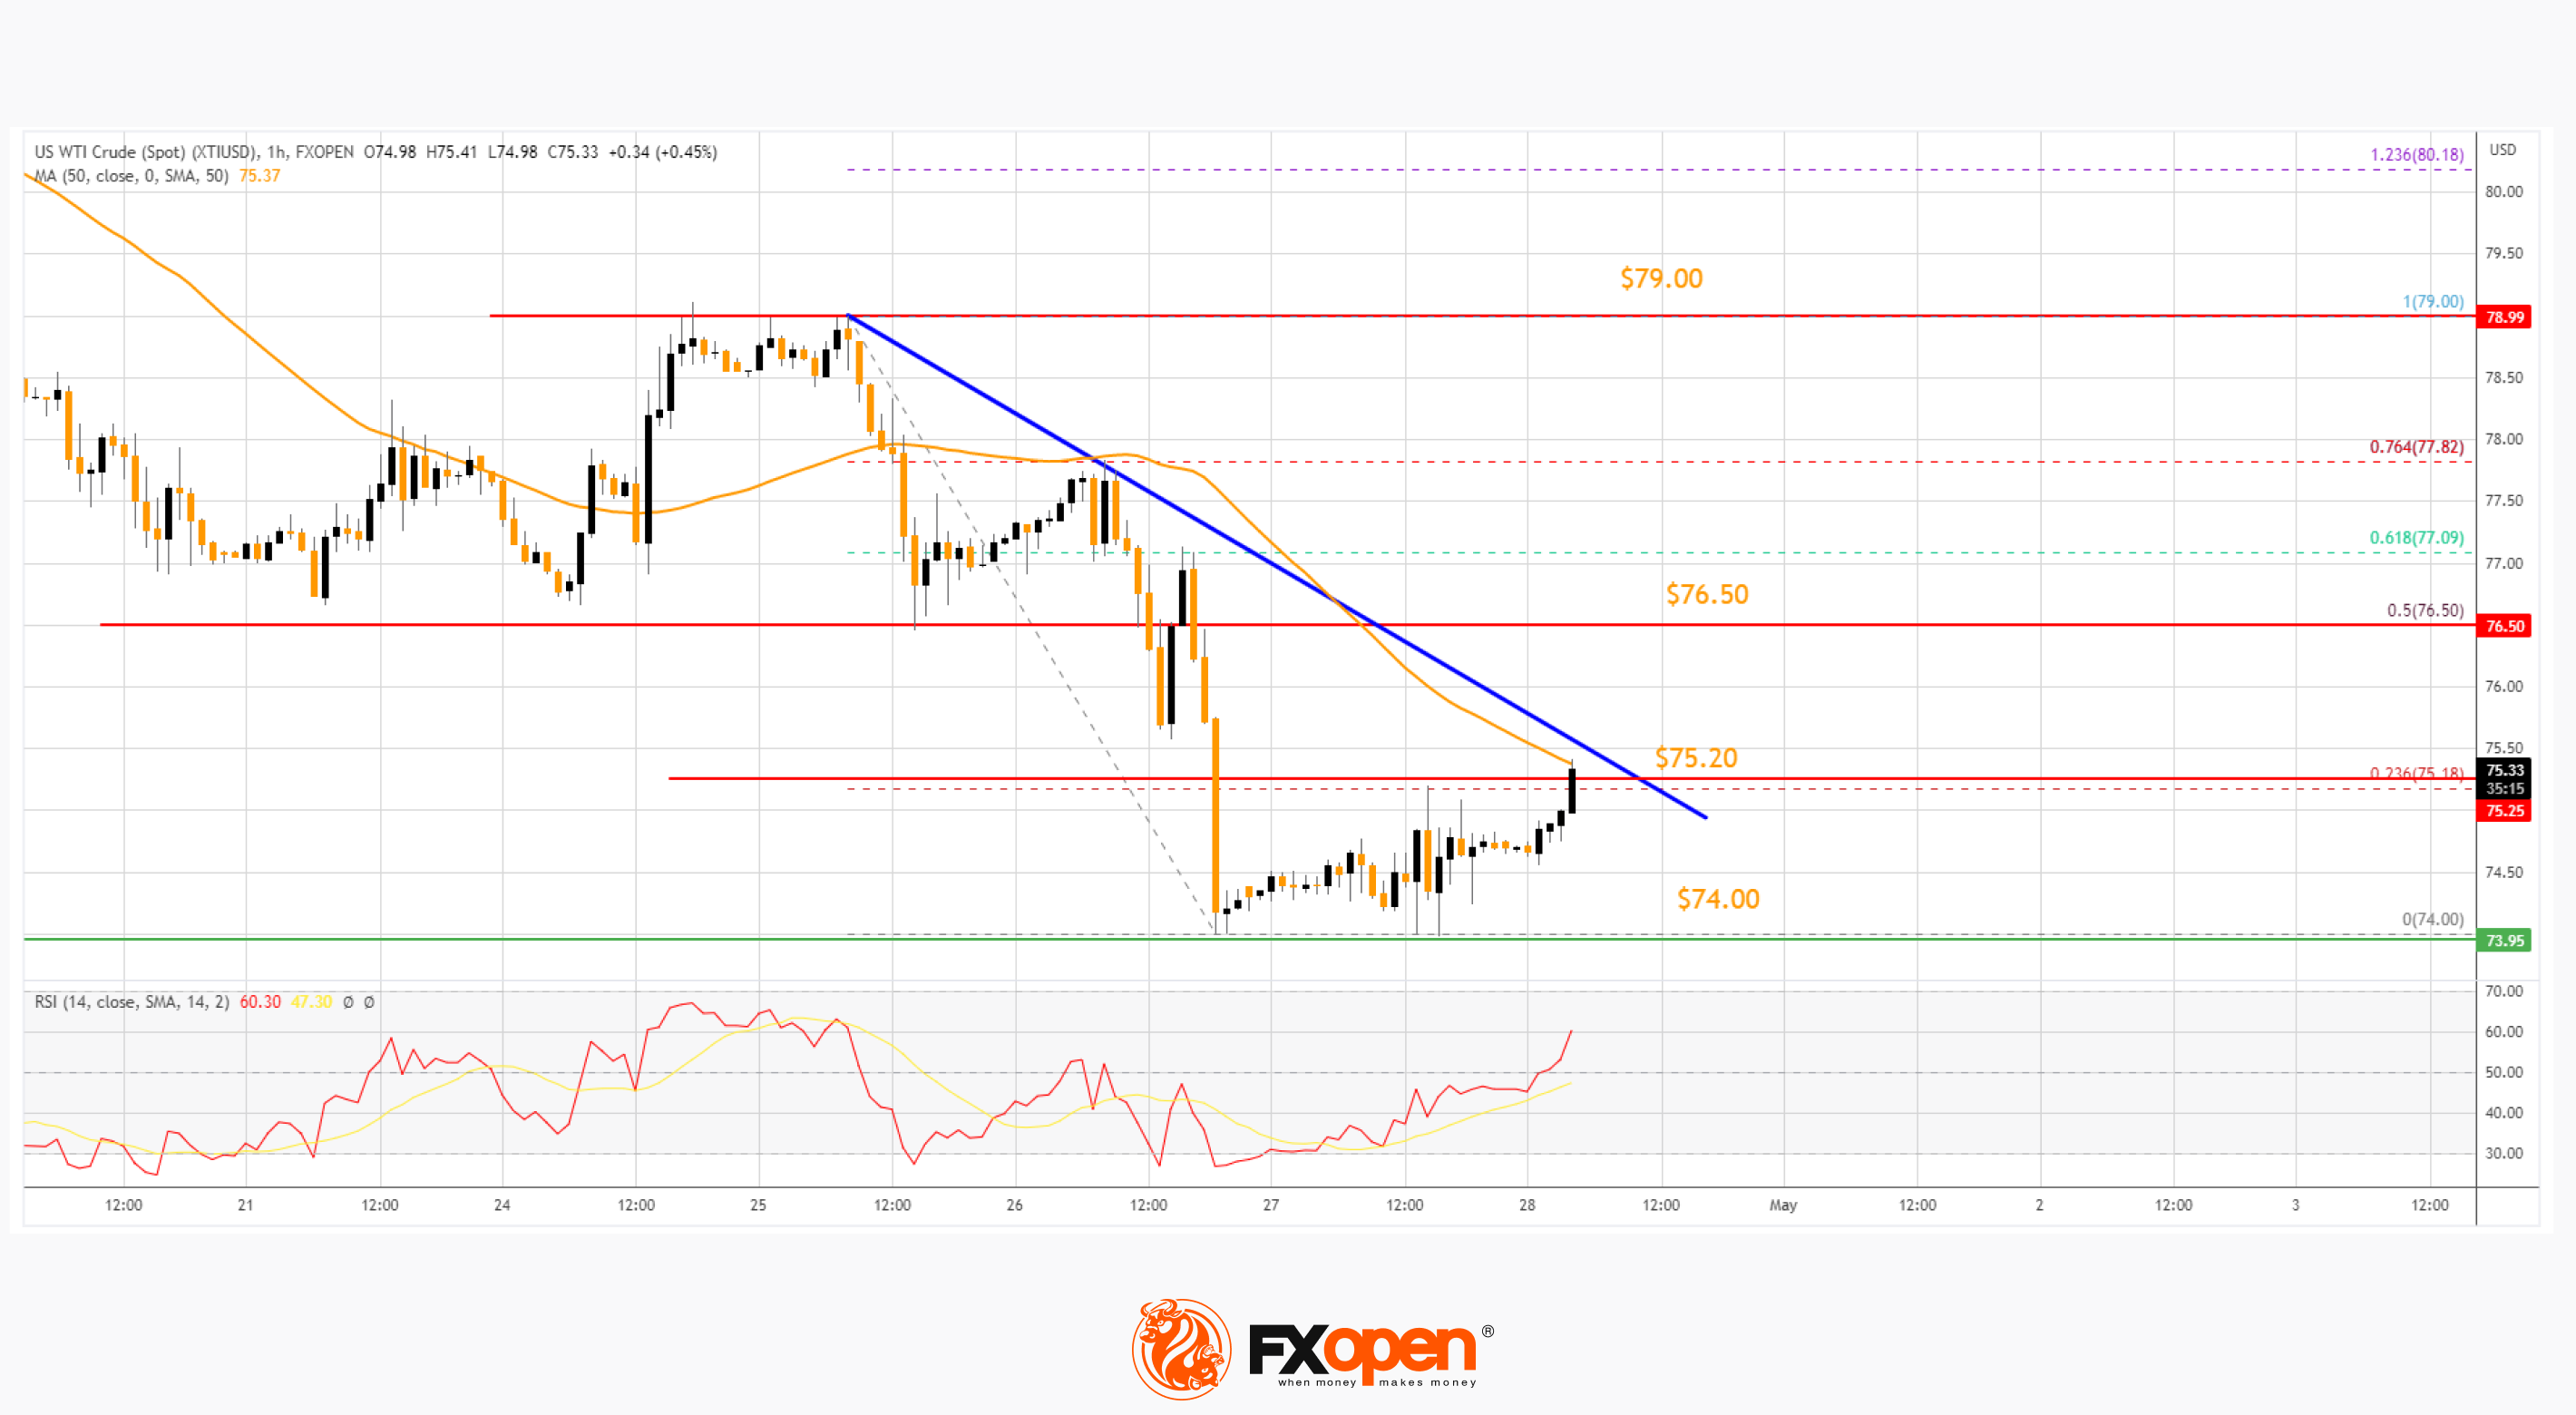
There is also a major bearish trend line forming with resistance near $75.20 and the 50-hour simple moving average. An upside break above the trend line resistance might send the price further higher.
The first major resistance is near the 50% Fib retracement level of the downward move from the $79.00 swing high to the $74.00 low at $76.50, above which the price might accelerate higher toward $79.00. Any more gains might send the price toward the $80.00 level in the coming days.
On the downside, support is near the $74.00 level. The next major support is near $72.50. If there is a downside break, the price might decline toward $70.00. Any more losses may perhaps open the doors for a move toward the $68.00 support zone.
This article represents FXOpen Companies’ opinion only, it should not be construed as an offer, invitation, or recommendation with respect to FXOpen Companies’ products and services or as financial advice.
Start trading commodity CFDs with tight spreads (additional fees may apply). Open your trading account now or learn more about trading commodity CFDs with FXOpen.
This article represents the opinion of the Companies operating under the FXOpen brand only. It is not to be construed as an offer, solicitation, or recommendation with respect to products and services provided by the Companies operating under the FXOpen brand, nor is it to be considered financial advice.
Stay ahead of the market!
Subscribe now to our mailing list and receive the latest market news and insights delivered directly to your inbox.


Latest articles

Weekly Market Insights with Gary Thomson: The Week of Central Banks and Earnings
In this video, we’ll explore the key economic events and market trends, shaping the financial landscape. Get ready for insights into financial markets to help you navigate the week ahead. Let’s dive in!
In this episode of Market

Intel at a Crossroads: Earnings Beat Meets Technical Resistance
Intel has just delivered its strongest quarter in over fifteen years, and the market reaction says it all. Q2 2026 revenue surged 25% year-over-year to $16.1 billion, crushing the consensus estimate of $14.42 billion, while adjusted EPS of

Tesla: Complex Range Structure Breaks Down Following Quarterly Earnings
Tesla released its Q2 2026 results after the market closed on 22 July. Revenue increased 26% year-on-year to $28.24 billion, while vehicle deliveries reached a record 480,126 units. However, operating margin fell sharply to 1.4%, down from