


Market Analysis: Gold Price and Crude Oil Price Signal Bearish Acceleration
FXOpen

Gold price started a sharp decline from $2,450. Crude oil prices declined steadily below the $80.00 support and moved into a bearish zone.
Important Takeaways for Gold and Oil Prices Analysis Today
· Gold price climbed higher toward the $2,450 zone before there was a sharp decline against the US Dollar.
· A key bearish trend line is forming with resistance near $2,375 on the hourly chart of gold at FXOpen.
· Crude oil prices extended downsides below the $78.00 support zone.
· A major bearish trend line is forming with resistance near $78.00 on the hourly chart of XTI/USD at FXOpen.
Gold Price Technical Analysis
On the hourly chart of Gold at FXOpen, the price rallied heavily above the $2,350 resistance. The price even spiked above $2,425 before the bears appeared.
A high was formed near $2,450 before there was a major decline. There was a move below the $2,400 support level. The bears even pushed the price below the $2,355 support and the 50-hour simple moving average.
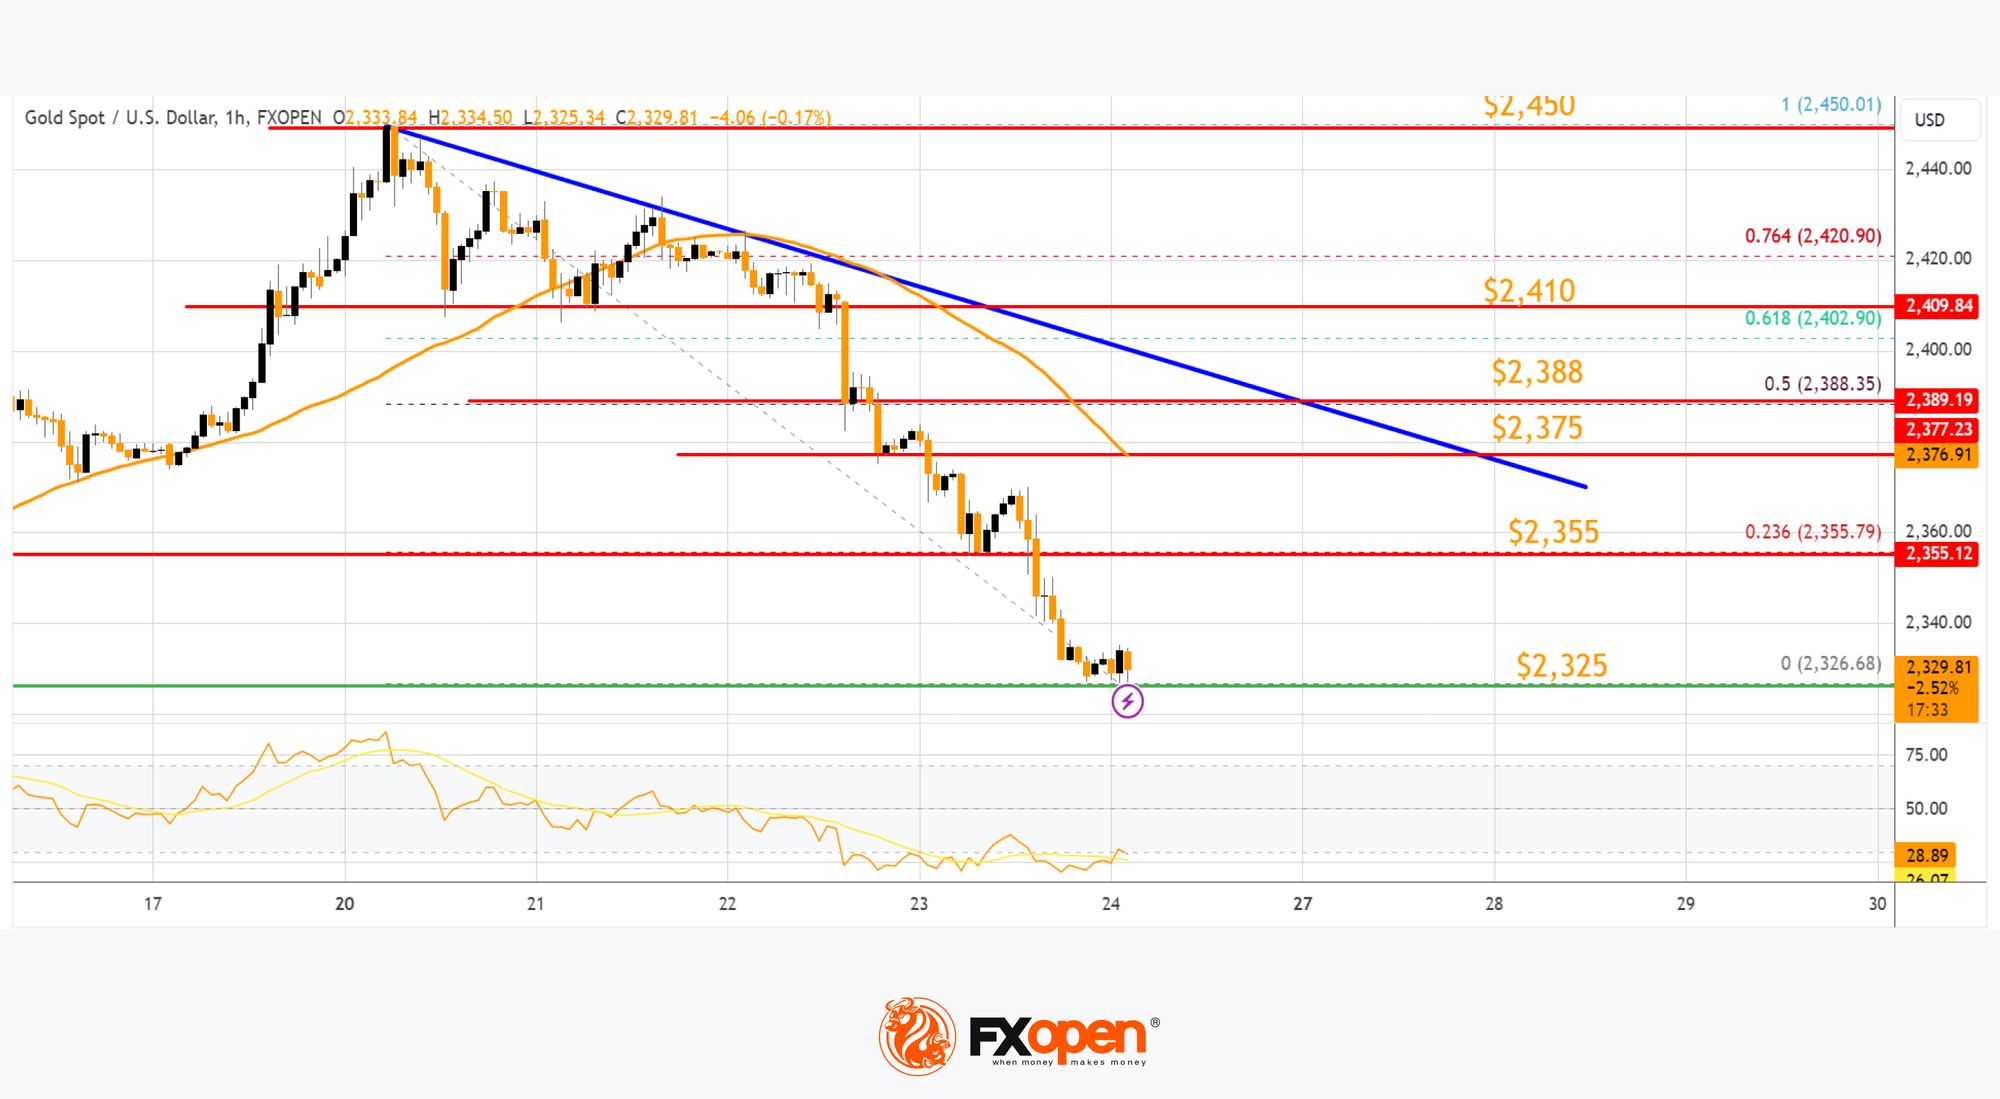
It tested the $2,325 zone. A low is formed near $2,326 and the price is now showing bearish signs. Immediate resistance is near the 23.6% Fib retracement level of the downward move from the $2,450 swing high to the $2,326 low at $2,355.
The next major resistance is near a bearish trend line at $2,375. The trend line is close to the 50-hour simple moving average.
The main resistance could be $2,388 and the 50% Fib retracement level of the downward move from the $2,450 swing high to the $2,326 low, above which the price could test the $2,410 resistance. The next major resistance is $2,450.
An upside break above the $2,450 resistance could send Gold price toward $2,480. Any more gains may perhaps set the pace for an increase toward the $2,500 level.
Initial support on the downside is near the $2,325 level. The first major support is near the $2,312 level. If there is a downside break below the $2,312 support, the price might decline further. In the stated case, the price might drop toward the $2,250 support.
Oil Price Technical Analysis
On the hourly chart of WTI Crude Oil at FXOpen, the price struggled to continue higher above $80.00 against the US Dollar. The price formed a short-term top and started a fresh decline below $78.00.
There was a steady decline below the $77.40 pivot level. The bears even pushed the price below $76.50 and the 50-hour simple moving average. Finally, the price tested the $76.30 zone. The recent swing low was formed near $76.31, and the price is now consolidating losses.
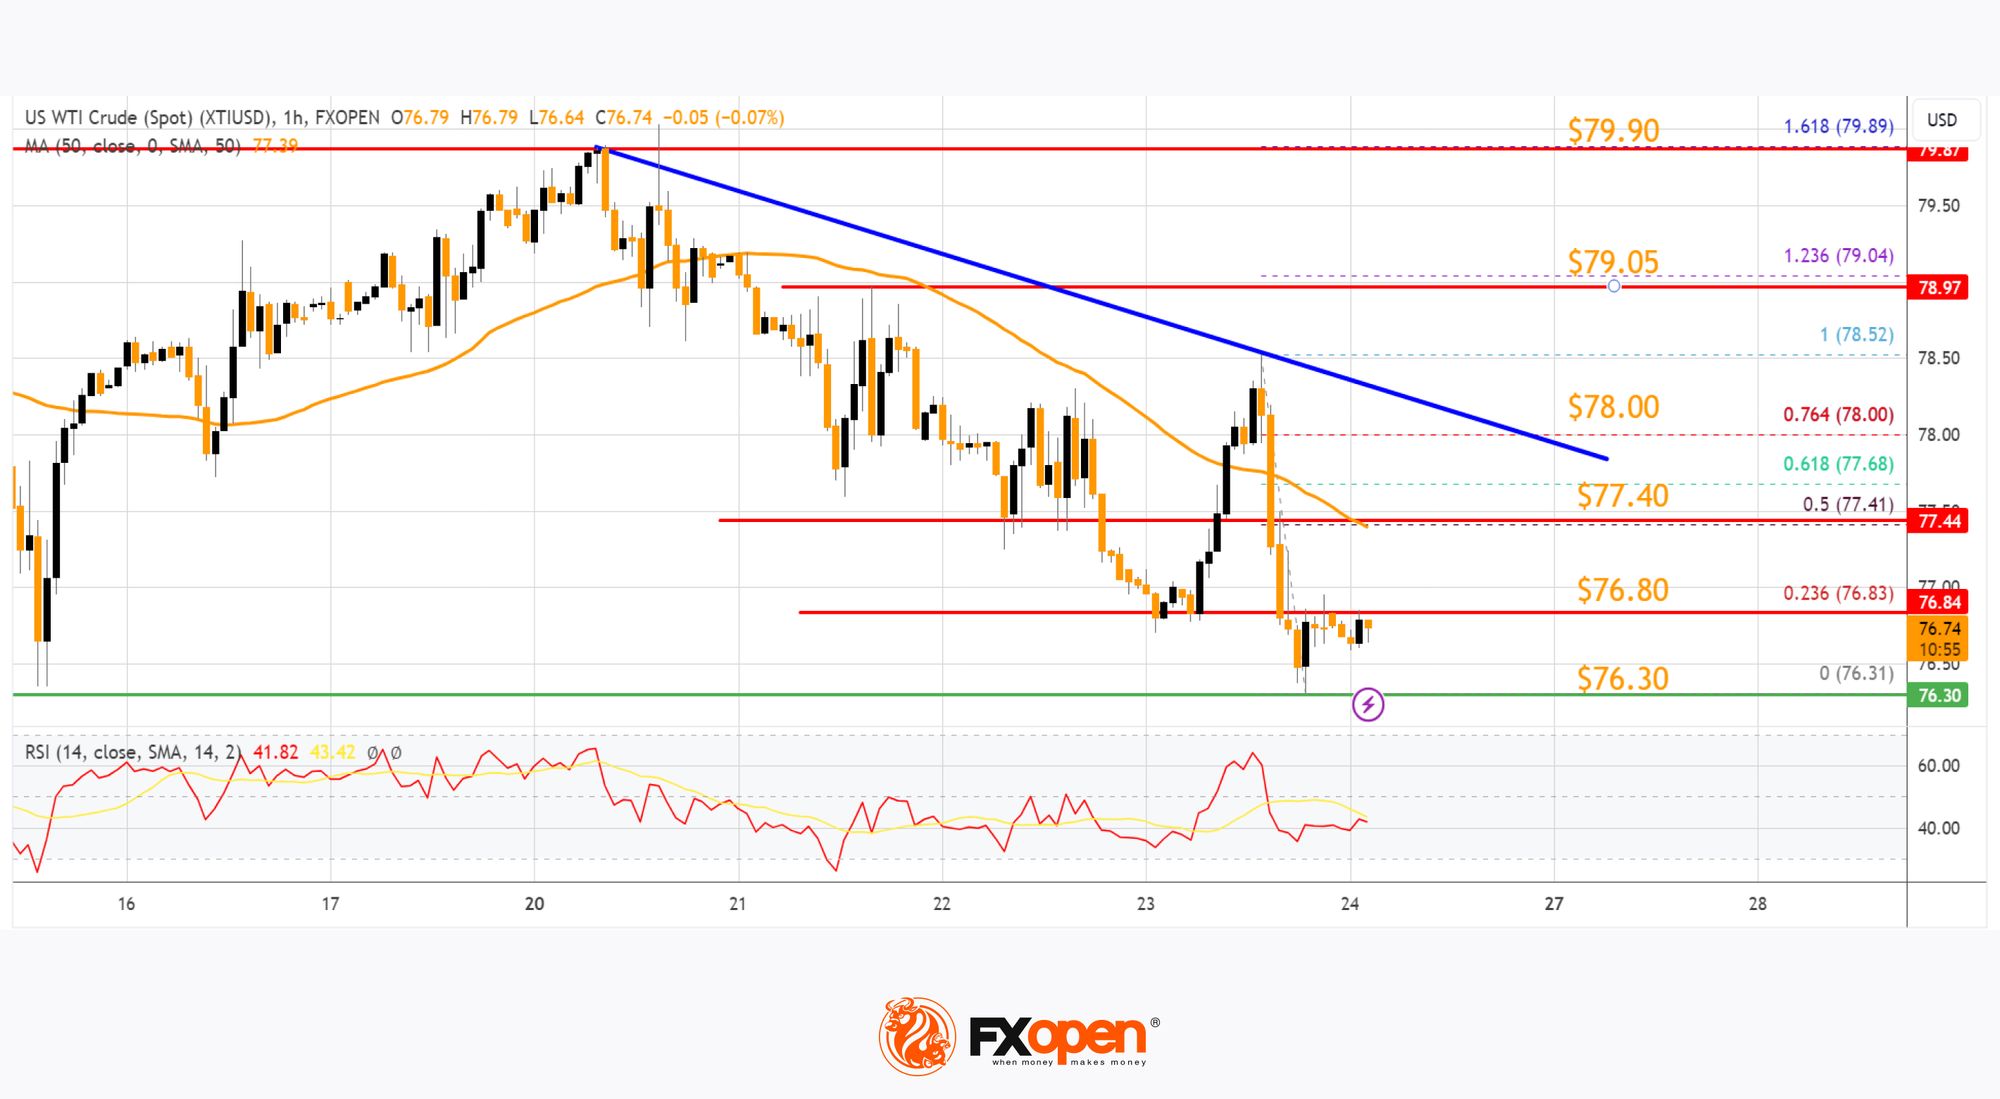
Immediate support is near the $76.30 level. The next major support on the WTI crude oil chart is near $75.00. If there is a downside break, the price might decline toward $73.50. Any more losses may perhaps open the doors for a move toward the $72.00 support zone.
On the upside, immediate resistance is near the 23.6% Fib retracement level of the downward move from the $78.52 swing high to the $76.31 low at $76.80.
The next resistance is near the 50-hour simple moving average and the 50% Fib retracement level of the downward move from the $78.52 swing high to the $76.31 low at $77.40. The main resistance is near a trend line at $78.00.
A clear move above the trend line resistance could send the price toward $79.05. The next key resistance is near $79.90. If the price climbs further higher, it could face resistance near $81.20. Any more gains might send the price toward the $82.00 level.
Start trading commodity CFDs with tight spreads (additional fees may apply). Open your trading account now or learn more about trading commodity CFDs with FXOpen.
This article represents the opinion of the Companies operating under the FXOpen brand only. It is not to be construed as an offer, solicitation, or recommendation with respect to products and services provided by the Companies operating under the FXOpen brand, nor is it to be considered financial advice.
Stay ahead of the market!
Subscribe now to our mailing list and receive the latest market news and insights delivered directly to your inbox.


Latest articles

Weekly Market Insights with Gary Thomson: US Inflation, UK GDP, Chair Warsh Testimony, and Earnings
In this video, we’ll explore the key economic events and market trends, shaping the financial landscape. Get ready for insights into financial markets to help you navigate the week ahead. Let’s dive in!
In this episode of Market

GBP/AUD Analysis: The Tug-of-War Begins
Oil is back in the driver's seat, and both the pound and the aussie are feeling its grip. The Bank of England held rates at 3.75% in June, but with UK inflation at 2.8% and crude oil climbing

Australian Dollar Holds Above the Current Market Profile
The minutes from the Reserve Bank of Australia's (RBA) June meeting, released on 30 June, suggested that policymakers are not yet ready to rule out further policy tightening. Board members noted persistent excess demand and broad-based inflationary pressures across the