


Market Analysis: Gold Price Dips Again and Crude Oil Price Turns Red
FXOpen

Gold price is correcting gains below the $2,040 support. Crude oil prices declined steadily below the $72.90 support and moved into a bearish zone.
Important Takeaways for Gold and Oil Prices Analysis Today
· Gold price climbed higher toward the $2,060 zone before it corrected lower against the US Dollar.
· A key bearish trend line is forming with resistance near $2,040 on the hourly chart of gold at FXOpen.
· Crude oil prices extended downsides below the $72.90 support zone.
· A major bearish trend line is forming with resistance near $72.20 on the hourly chart of XTI/USD at FXOpen.
Gold Price Technical Analysis
On the hourly chart of Gold at FXOpen, the price rallied heavily above the $2,040 resistance. The price even spiked above $2,060 before there was a downside correction.
There was a move below the $2,040 support level. The bears even pushed the price below the $2,030 support and the 50-hour simple moving average. It tested the $2,020 zone. A low is formed near $2,019.32 and the price is now showing bearish signs.
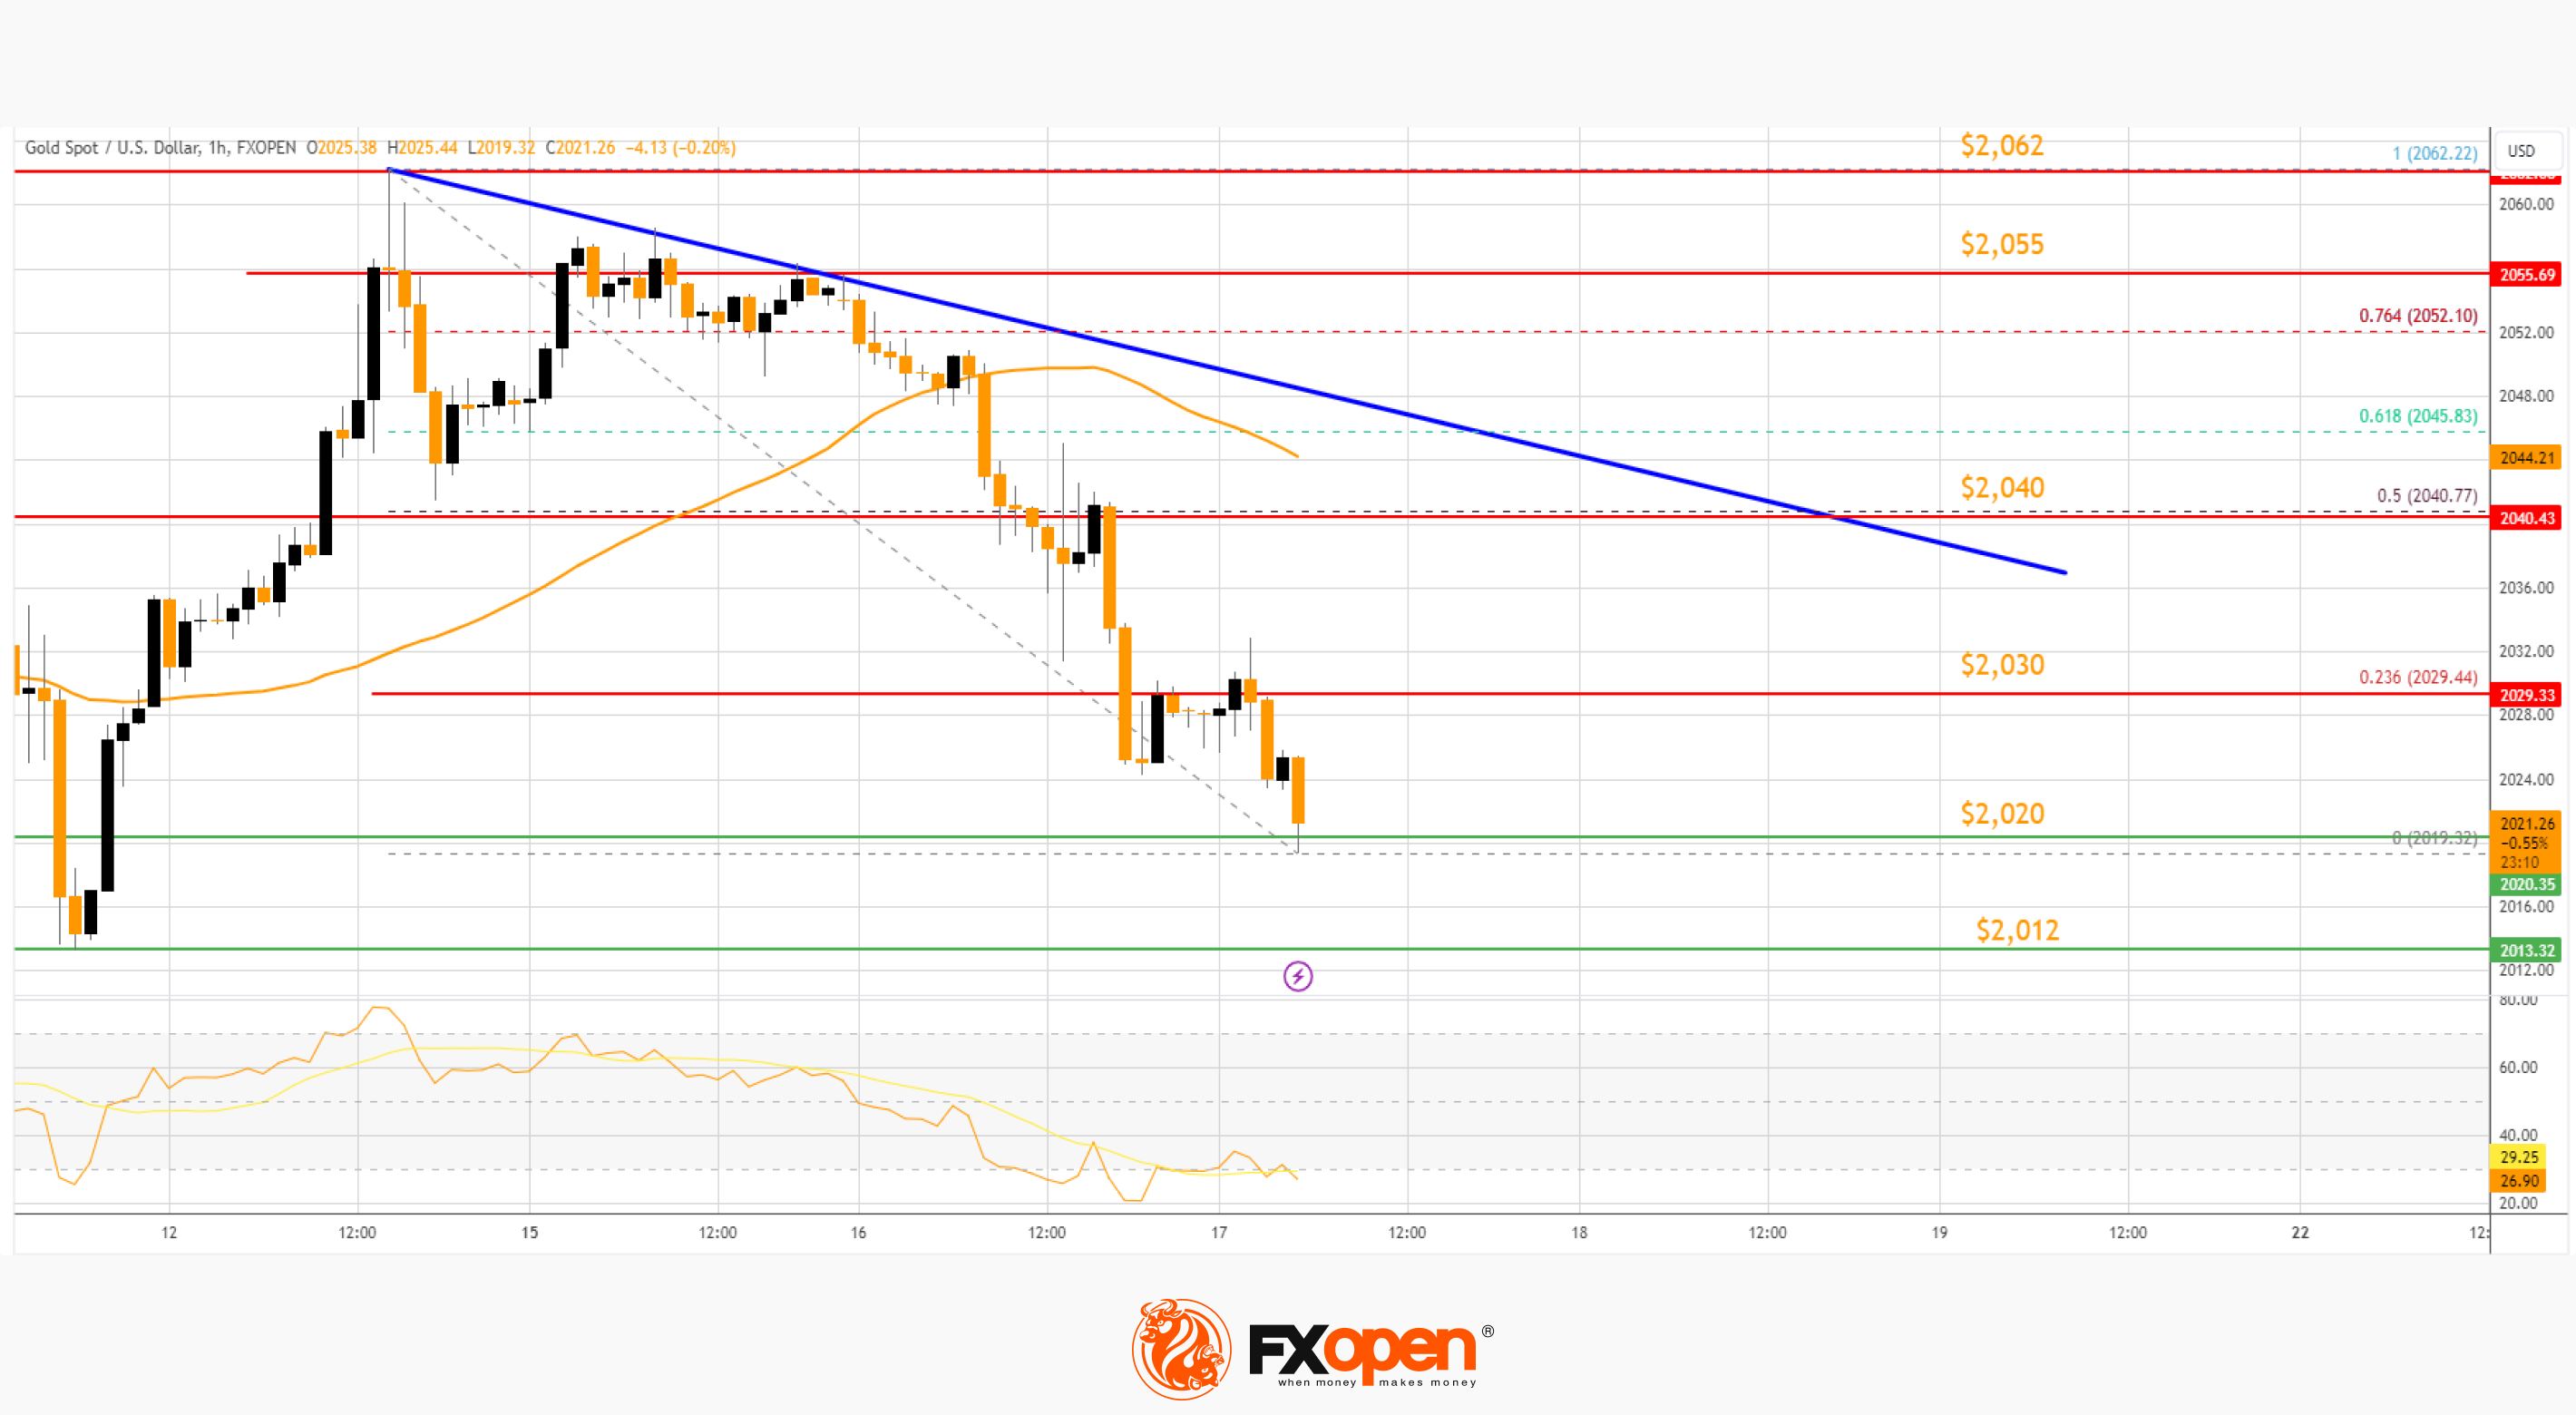
Immediate resistance is near the 23.6% Fib retracement level of the downward move from the $2,062 swing high to the $2,019 low at $2,030.
The next major resistance is near a bearish trend line at $2,040. The trend line is close to the 50-hour simple moving average and coincides with the 50% Fib retracement level of the downward move from the $2,062 swing high to the $2,019 low.
The main resistance could be $2,055, above which the price could test the $2,070 resistance. The next major resistance is $2,080. An upside break above the $2,080 resistance could send Gold price toward $2,120. Any more gains may perhaps set the pace for an increase toward the $2,135 level.
Initial support on the downside is near the $2,020 level. The first major support is near the $2,012 level. If there is a downside break below the $2,012 support, the price might decline further. In the stated case, the price might drop toward the $1,980 support.
Oil Price Technical Analysis
On the hourly chart of WTI Crude Oil at FXOpen, the price struggled to continue higher above $75.20 against the US Dollar. The price formed a short-term top and started a fresh decline below $74.50.
There was a steady decline below the $72.90 pivot level. The bears even pushed the price below $72.20 and the 50-hour simple moving average. Finally, the price tested the $71.40 zone. The recent swing low was formed near $71.69, and the price is now consolidating losses.
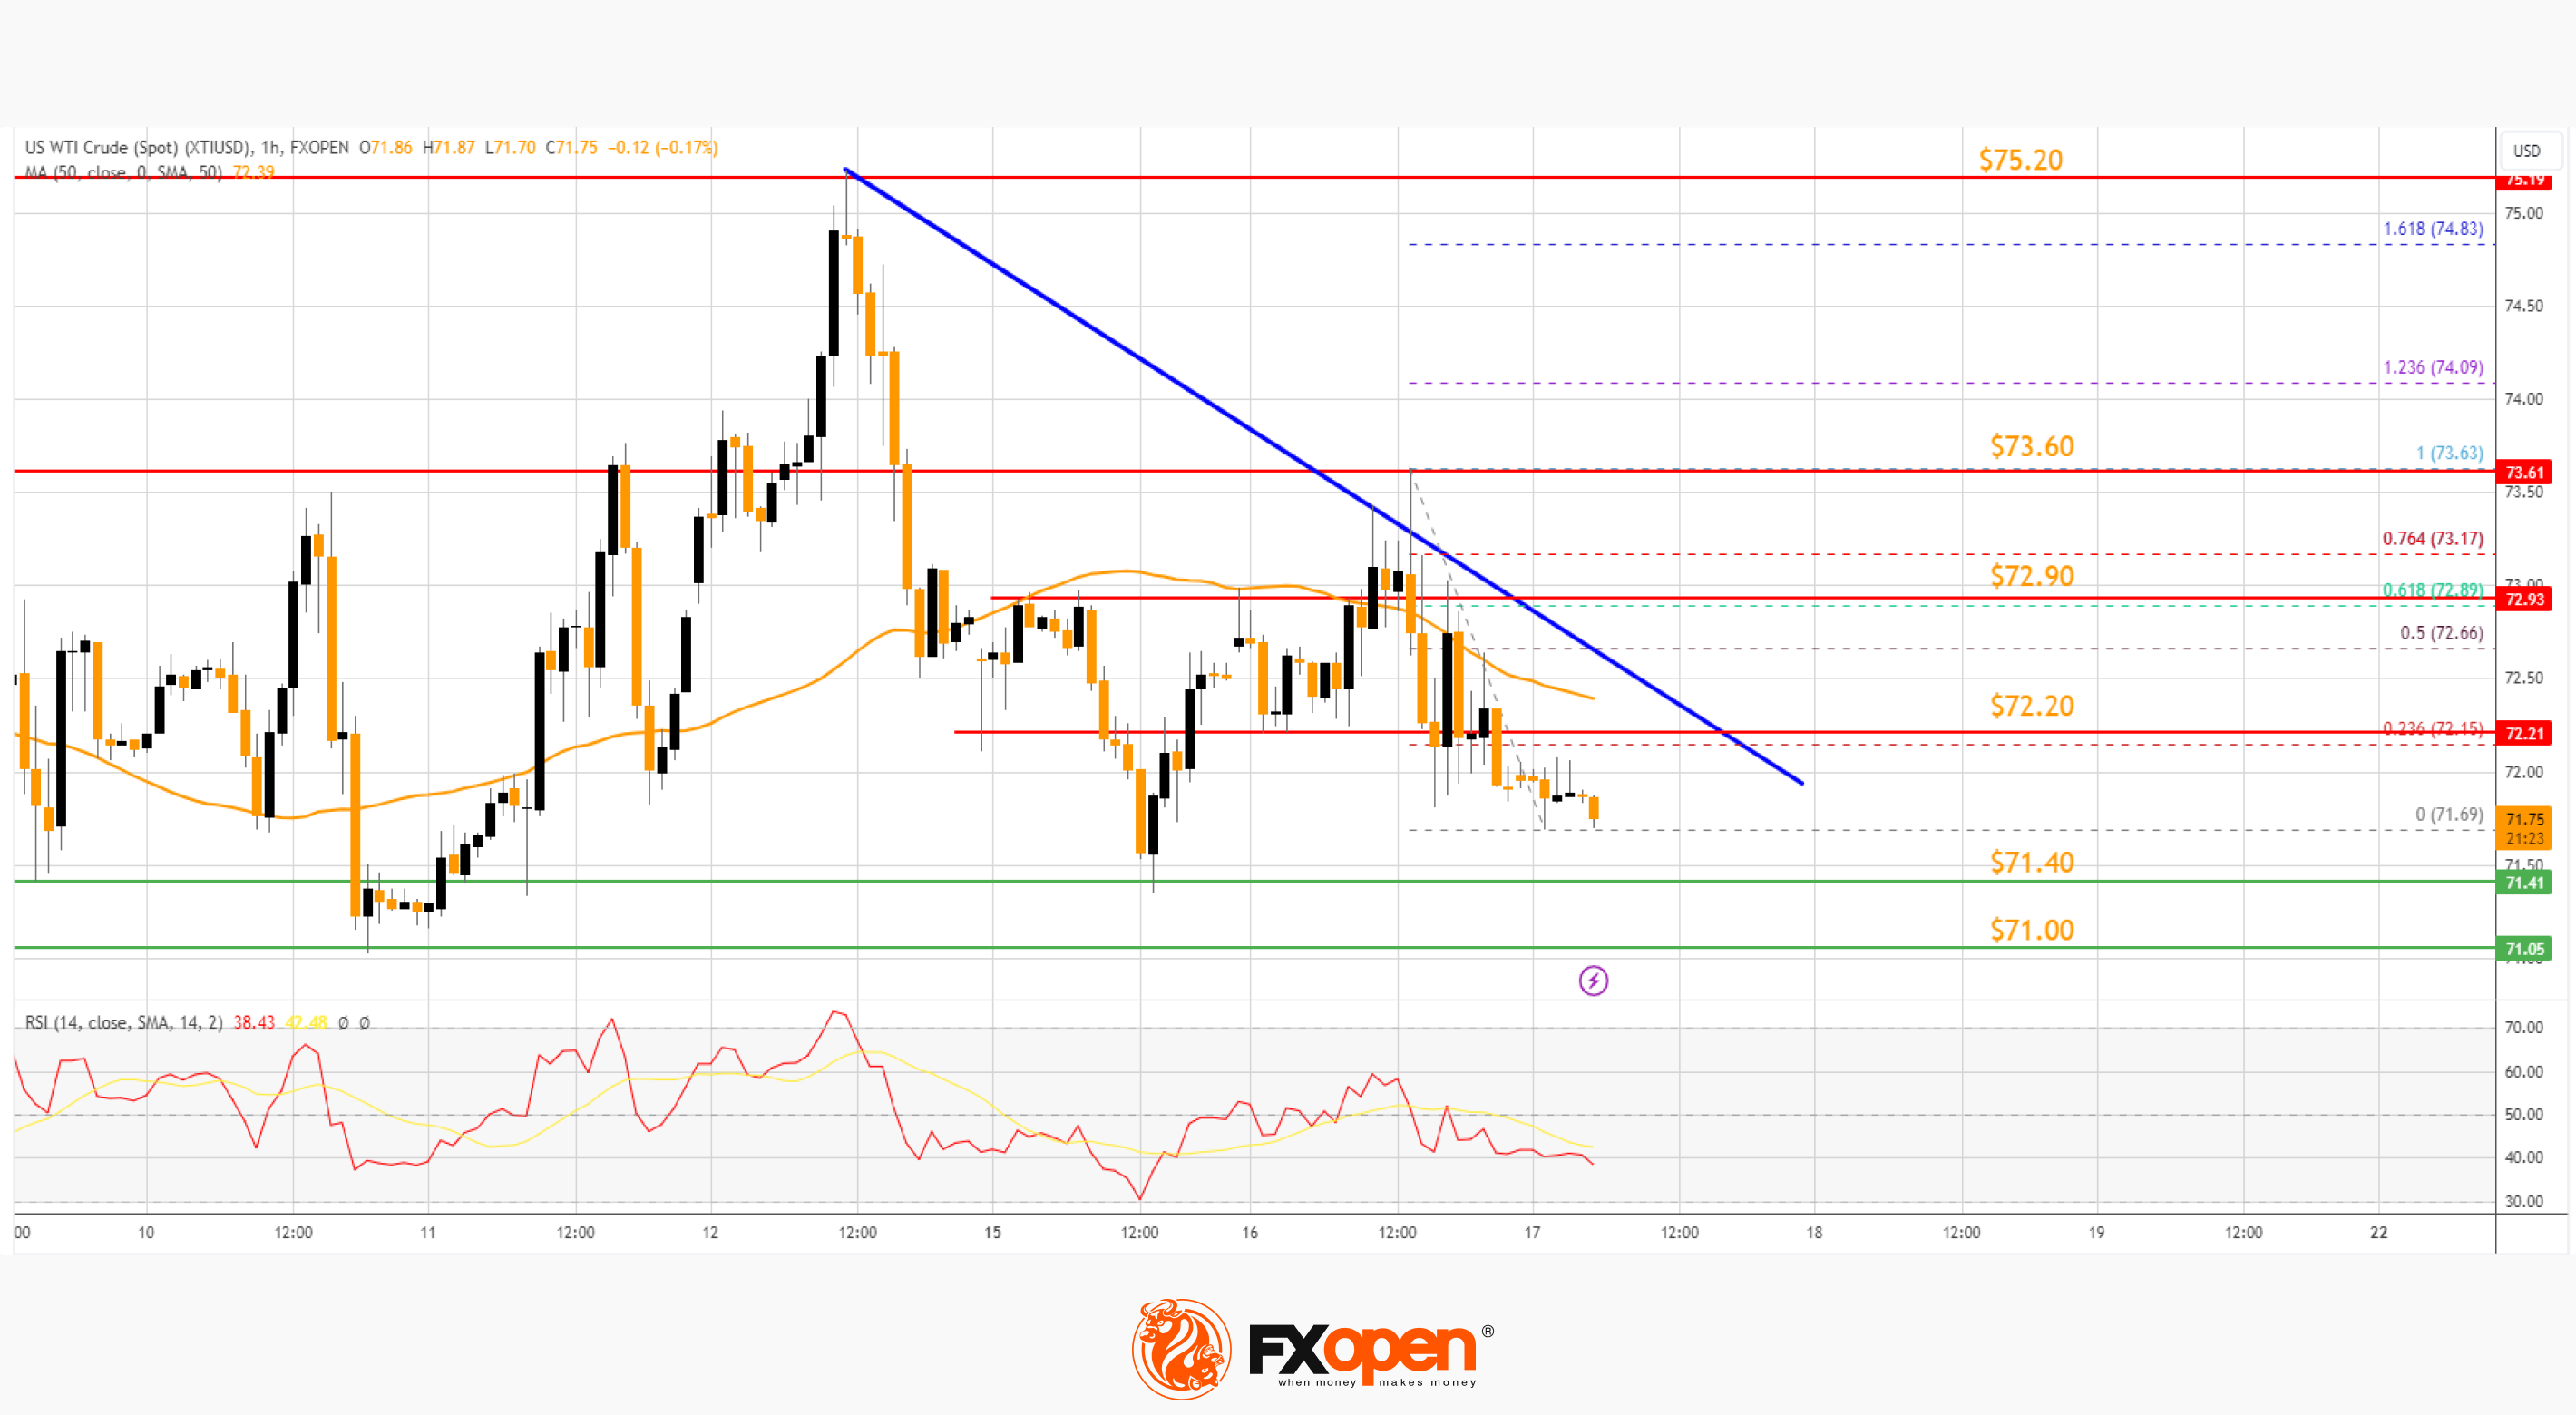
Immediate support is near the $71.40 level. The next major support on the WTI crude oil chart is near $71.00. If there is a downside break, the price might decline toward $70.00. Any more losses may perhaps open the doors for a move toward the $68.00 support zone.
On the upside, immediate resistance is near a major bearish trend line at $72.20. It is close to the 23.6% Fib retracement level of the downward move from the $73.63 swing high to the $71.69 low.
The next resistance is near the 61.8% Fib retracement level of the downward move from the $73.63 swing high to the $71.69 low at $72.90. A clear move above the trend line resistance and $72.90 could send the price toward $73.60.
The next key resistance is near $75.20. If the price climbs further higher, it could face resistance near $78.00. Any more gains might send the price toward the $80.00 level.
Start trading commodity CFDs with tight spreads (additional fees may apply). Open your trading account now or learn more about trading commodity CFDs with FXOpen.
This article represents the opinion of the Companies operating under the FXOpen brand only. It is not to be construed as an offer, solicitation, or recommendation with respect to products and services provided by the Companies operating under the FXOpen brand, nor is it to be considered financial advice.
Stay ahead of the market!
Subscribe now to our mailing list and receive the latest market news and insights delivered directly to your inbox.


Latest articles

Brent Crude Oil: From Ceasefire to Crossfire — What's Next?
Just weeks ago, traders were pricing in peace. Now they're pricing in war again—and that reversal says everything about how fragile the current Middle East calm really is.
Brent crude has surged to $86 a barrel, its highest level

AUD/USD and USD/CAD React to Softer US Inflation
Commodity-linked currencies strengthened after US inflation data came in weaker than expected. The Consumer Price Index (CPI) slowed to 3.5% year-on-year in June, below the 3.8% forecast, while core inflation eased to 2.6% versus expectations of 2.

NVIDIA: Kyber NVL144 Dispute Weighs on the Stock
NVIDIA shares found themselves at the centre of debate over the future of the Kyber NVL144 system. On 6 July, CNBC, citing research firm SemiAnalysis, reported that the project could be delayed by more than a year—from 2027 to