


Bitcoin, Litecoin in Limbo as Direction Awaited
FXOpen
Bitcoin continues to trade range-bound as we wait for direction. While the crypto lost about $10 dollars since our last update, no major levels have been broken. Bitcoin’s little brother, Litecoin, is also trading undecided after a brief spike above $1.50 dollars.
Bitcoin Waits for Direction
Everyone’s favorite cryptocurrency had several daily losses in a row, declining by $1.50, $0.40 and $3.10 dollars. But like we mentioned above, the slow drip lower hasn’t broken any important levels. Bitcoin is currently trading at $232 dollars per coin.
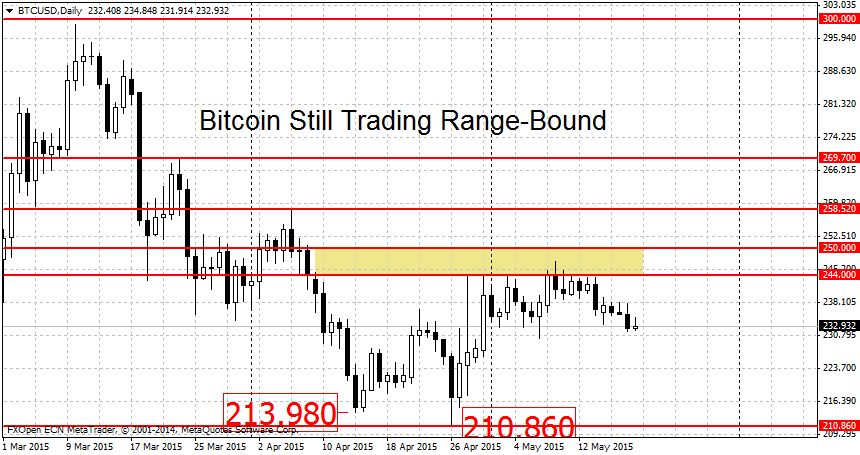
This is just above the weak support at $230 dollars. A more important support area can be found between the April 26th swing low at $210.86 and the round $200 dollars figure. A decisive break of this area should spark a new BTC downtrend. On the higher end, the deciding barrier is $250 dollars. A BTC/USD breakout above it may trigger a new rally. Notable resistance levels higher up are $258 (weak), followed by $270 and $300 dollars. As we’ve been repeating for the past few months, the $300 mark is very important. This is a former triple top for bitcoin that stopped two previous rallies (see chart below). A clean breakout above it should exacerbate the gains.
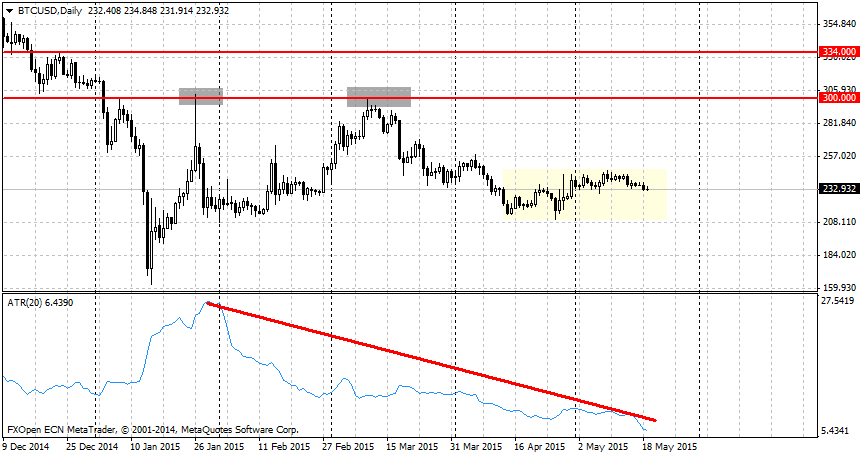
Along with the range-bound price movement, volatility has suffered as well. The 20 day average true range is now down to $6.43 dollars. The 20 ATR has seen a steady decline from reaching a high of $26.53 on January 29th. Coincidentally, this was also the day when BTC failed to break above the important $300 dollars mark. In this low volatility environment, it’s probably best to stay on the sidelines and wait for the market to give us direction first.
Litecoin Briefly Spikes Above $1.50
Litecoin spiked above the $1.50 dollars resistance last Wednesday, hitting the next resistance level at $1.60 before falling back. But the gains proved to be elusive as the move retraced completely in the same minute. I wasn’t watching the markets when this happened so not sure if this was a bad tick or caused by an exhaustion of the orderbook. In any case, the $1.50 dollars level hasn’t been broken and remains to be valid.
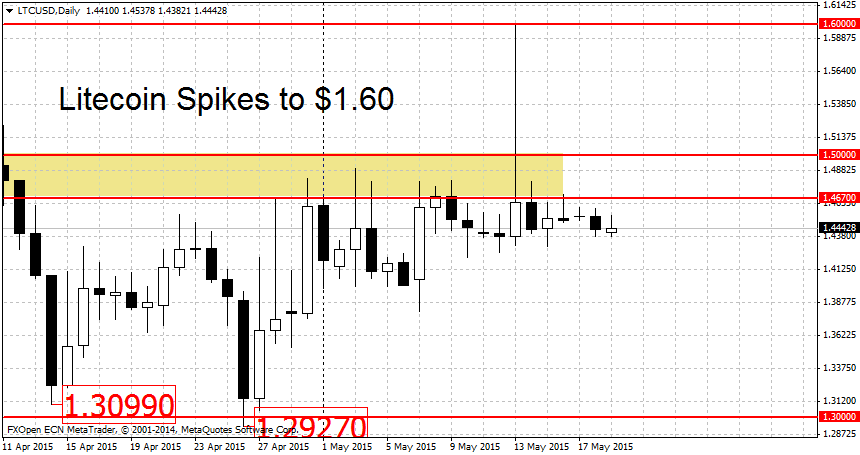
A clean breakout above $1.50, not just a brief spike above like what happened on Wednesday, may usher in a period of more LTC gains. Important resistance levels above the mark can be found at $1.60 and $1.70. Higher up there is the March 23rd swing high at $1.7961. On the downside, the double bottom near $1.30 per coin should provide some support to falling prices. However if the bears can clear this level, the downtrend may resume and lead to more losses for Litecoin.
FXOpen offers the world's most popular cryptocurrency CFDs*, including Bitcoin and Ethereum. Floating spreads, 1:2 leverage — at your service (additional fees may apply). Open your trading account now or learn more about crypto CFD trading with FXOpen.
*Important: At FXOpen UK, Cryptocurrency trading via CFDs is only available to our Professional clients. They are not available for trading by Retail clients. To find out more information about how this may affect you, please get in touch with our team.
This article represents the opinion of the Companies operating under the FXOpen brand only. It is not to be construed as an offer, solicitation, or recommendation with respect to products and services provided by the Companies operating under the FXOpen brand, nor is it to be considered financial advice.
Stay ahead of the market!
Subscribe now to our mailing list and receive the latest market news and insights delivered directly to your inbox.


Latest articles

DAX 40: consolidation amid technology sell-off
A wave of selling in the technology sector that emerged earlier this week has weighed on European equities. The trigger was investor concern over the profitability of large-scale debt-funded investments by major US tech companies in AI infrastructure. The Nasdaq

Euro Hits Fresh Yearly Lows Amid Dovish ECB Signals
The euro remains under pressure following weak macroeconomic data from the euro area and fresh signals that the European Central Bank is prepared to maintain a more accommodative monetary policy stance. Data released yesterday pointed to a deterioration in business

Pound at Key Levels: Markets Assess Impact of Political Uncertainty in the UK
The British pound remains under pressure following increased political uncertainty in the United Kingdom triggered by the Prime Minister’s resignation. Investors are assessing potential shifts in the political and economic policy outlook after the head of government stepped down,