


BTC and XRP - Bullish price action seen
FXOpen

BTC/USD
From last week when the price of Bitcoin was trading at around $9950 at its lowest point, we have seen an increase of 8.86%. This is measured to the current price point at $10816.9 which is the highest price has been this week. The price is an upward trajectory with strong bullish momentum as it started spiking by 1.69% today coming from $10637 daily low to the current high.
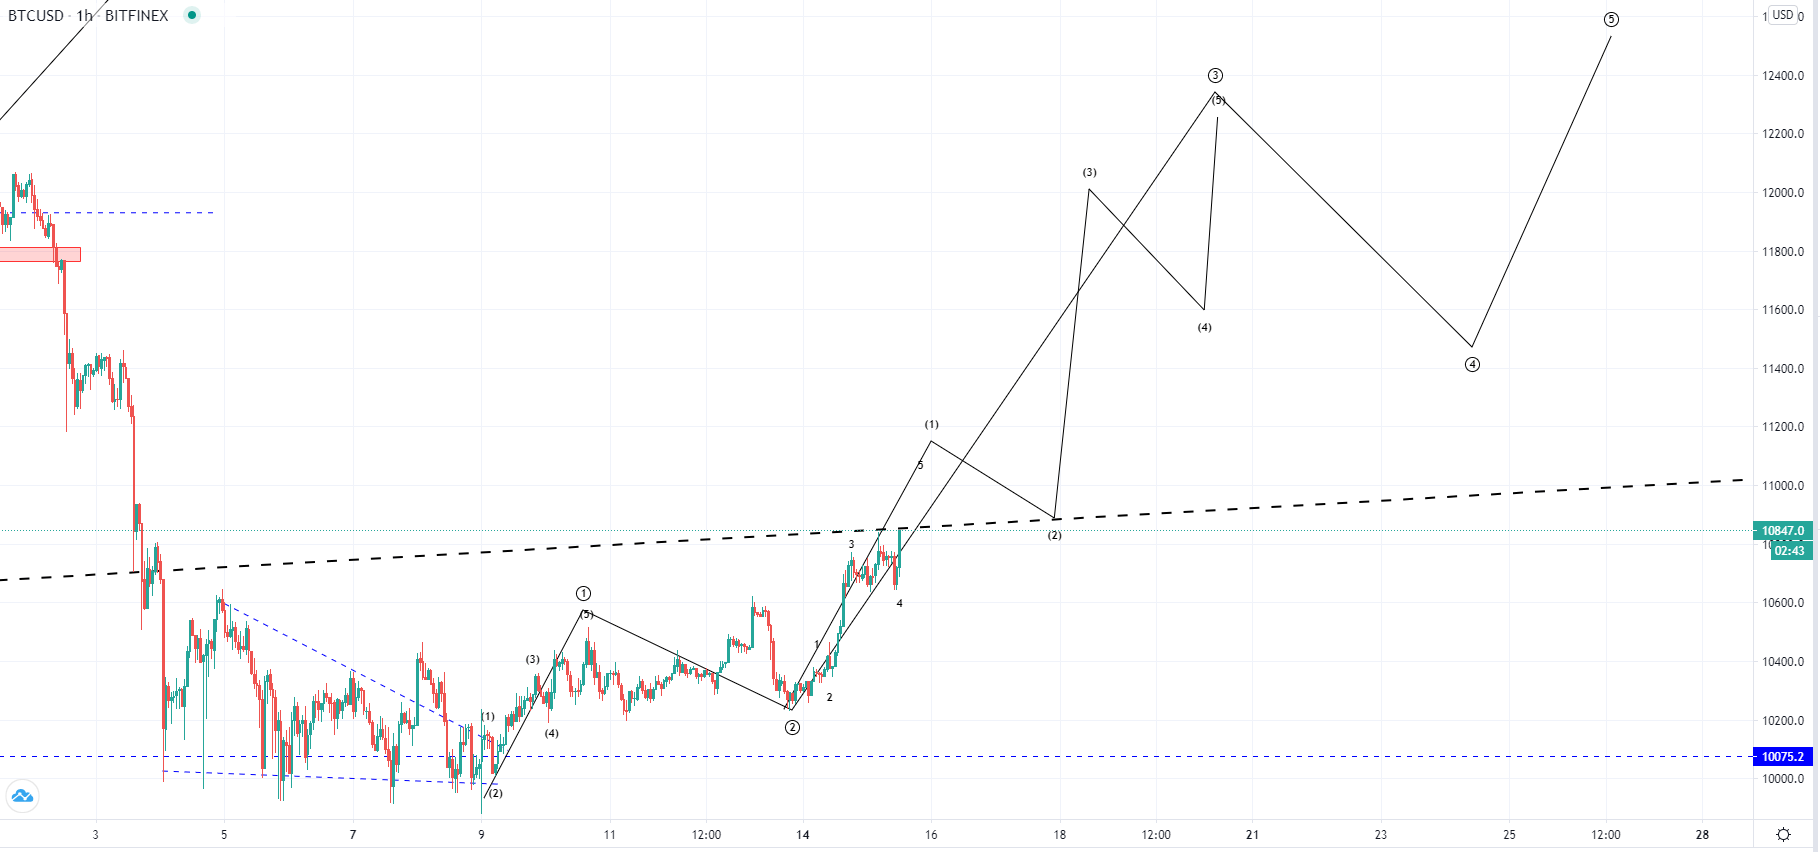
On the hourly chart, you can see that the price made a breakout from last week’s descending triangle after a third retest of the $10000 zone. As the price found support there and a couple of dips below it found the initial price chase as it activated buying we have seen an impulsive move to the upside. It first came to retest the triangle’s high level forming a minor cup and handle. The handle which was formed from last Thursday to Monday low was indicative of further price growth.
These two structures are very likely the first two sub-wave of the higher degree five-wave move to the upside. This is so if we have seen the completion of the corrective move that started on the 2nd of August when the price first reached $12000. If the correction ended last week dipping just slightly below $10000 then another 5th wave of an even higher degree count is set to start and bring the price of Bitcoin above it prior to $12000 high, and potentially into the area of last years June and July at around $13500.
But now as the price is currently retesting the significant ascending trendline and is showing the completion of the 5th wave from the minuscule count we are like to see a minor breakout above the significant level and its retest for support on its 2nd wave for the submicro count.
XRP/USD
Yesterday the price of Ripple has been sitting at $0.23782 at its lowest point and from there made an increase of 4.74% coming to $0.24910 at its highest. At the moment the price is being traded slightly lower but has mostly been in an upward trajectory today spiking above its minor horizontal pivot point.
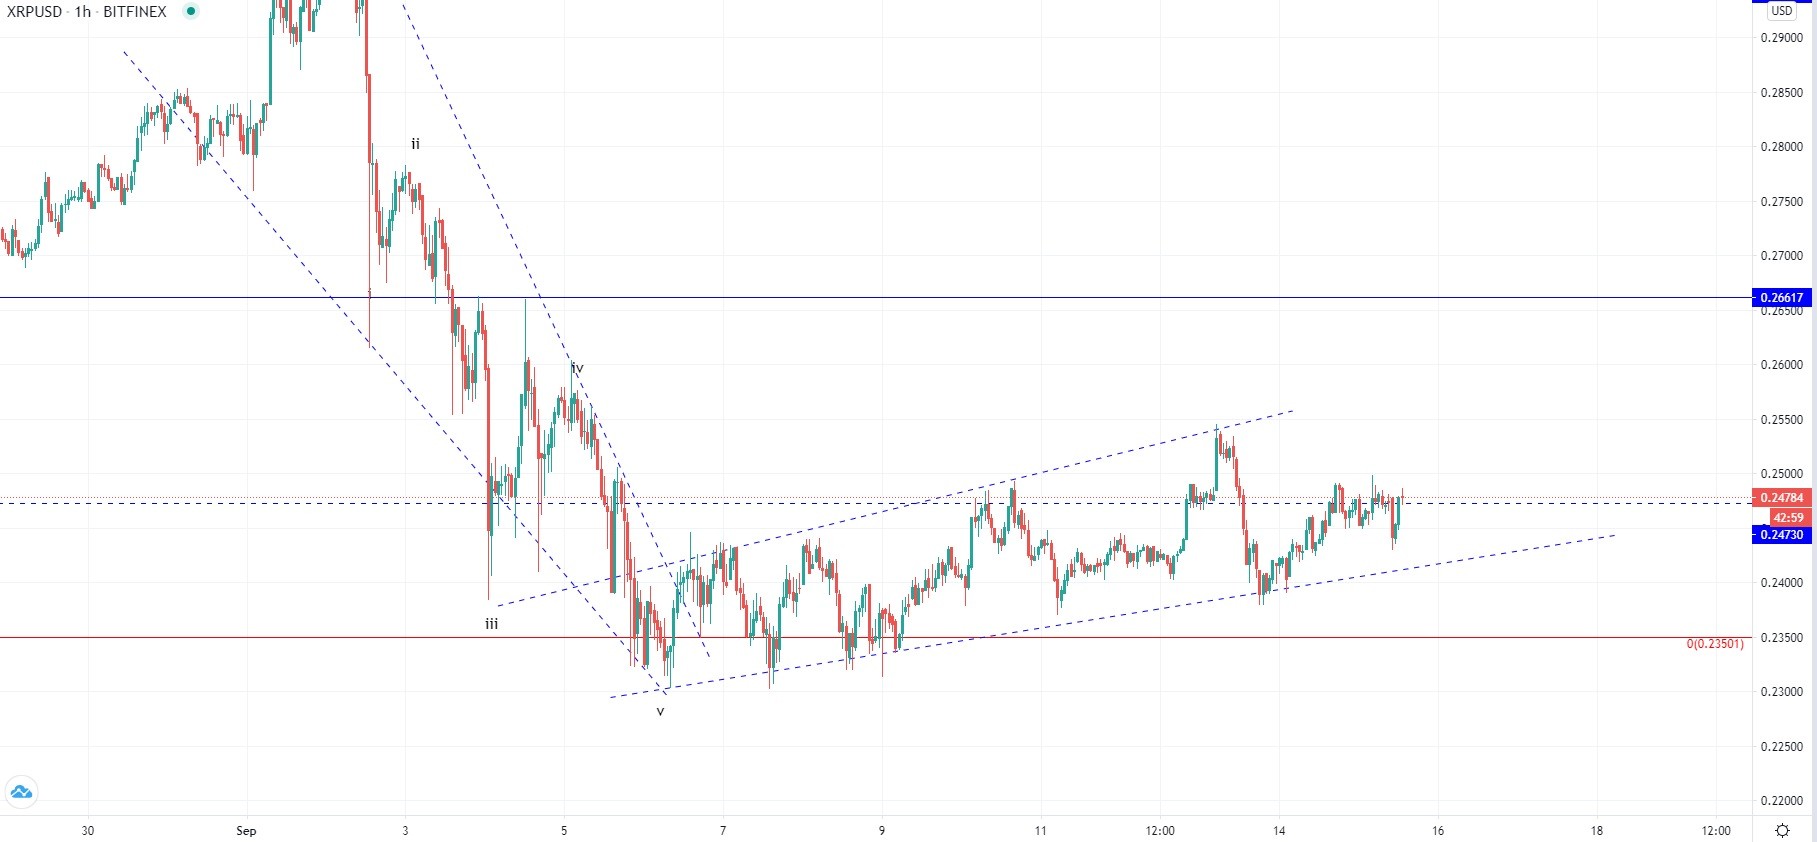
Looking at the hourly chart, you can see that from last week an ascending channel was formed in which the price bounced and made higher high and lower lows. Unlike in the case of Bitcoin where we have seen a clear impulsive move, the price action of Ripple has shown a more steady pattern. This could indicate that the recovery seen from last week is still corrective in nature and we are to see further lows after it ends. In that case, it would indicate that the correction for the higher degree and started on the 2nd of August hasn’t ended.
In the near-term, another increase would be expected from the price of Ripple potentially as a retest of the next significant horizontal level to the upside which is at $0.26617. If however, the ascending channel turns out to be a leading diagonal the price would be set to continue increasing in a sustainable way coming above it previous high at $0.3 area.
FXOpen offers the world's most popular cryptocurrency CFDs*, including Bitcoin and Ethereum. Floating spreads, 1:2 leverage — at your service (additional fees may apply). Open your trading account now or learn more about crypto CFD trading with FXOpen.
*Important: At FXOpen UK, Cryptocurrency trading via CFDs is only available to our Professional clients. They are not available for trading by Retail clients. To find out more information about how this may affect you, please get in touch with our team.
This article represents the opinion of the Companies operating under the FXOpen brand only. It is not to be construed as an offer, solicitation, or recommendation with respect to products and services provided by the Companies operating under the FXOpen brand, nor is it to be considered financial advice.
Stay ahead of the market!
Subscribe now to our mailing list and receive the latest market news and insights delivered directly to your inbox.


Latest articles

Apple: Earnings Day Above the Activity Zone
On 30 April, after the market close, Apple Inc. will release its financial results for the second quarter of fiscal 2026. The consensus forecast, based on estimates from 31 analysts, points to revenue of around $109.7 billion, with expected

USD/JPY and USD/CHF Near Key Levels: The Dollar Supported by the Fed
The US dollar continues to trend upwards following the Federal Reserve meeting, drawing support from the regulator’s moderately hawkish stance and comments by Jerome Powell. Markets interpret the Fed’s rhetoric as a signal that restrictive policy is likely

EUR/USD and GBP/USD consolidate ahead of the Fed decision
European currencies are showing subdued dynamics, entering a consolidation phase following their previous advance. Earlier, EUR/USD and GBP/USD broke out of their ranges and strengthened; however, the subsequent correction has led both pairs to retest the previously breached