


BTC and XRP - Correction developing but for how long?
FXOpen

BTC/USD
The price of Bitcoin has continued increasing from last week and came to $24,310 at its highest points yesterday from which it decreased by 10.11% at first, but is now making a recovery and is currently sitting at $23,478 level. This minor pullback we have seen yesterday could have been the beginning of the higher degree descending move as the prior impulse to the upside ended but since the price is starting to increase again we are yet to see.
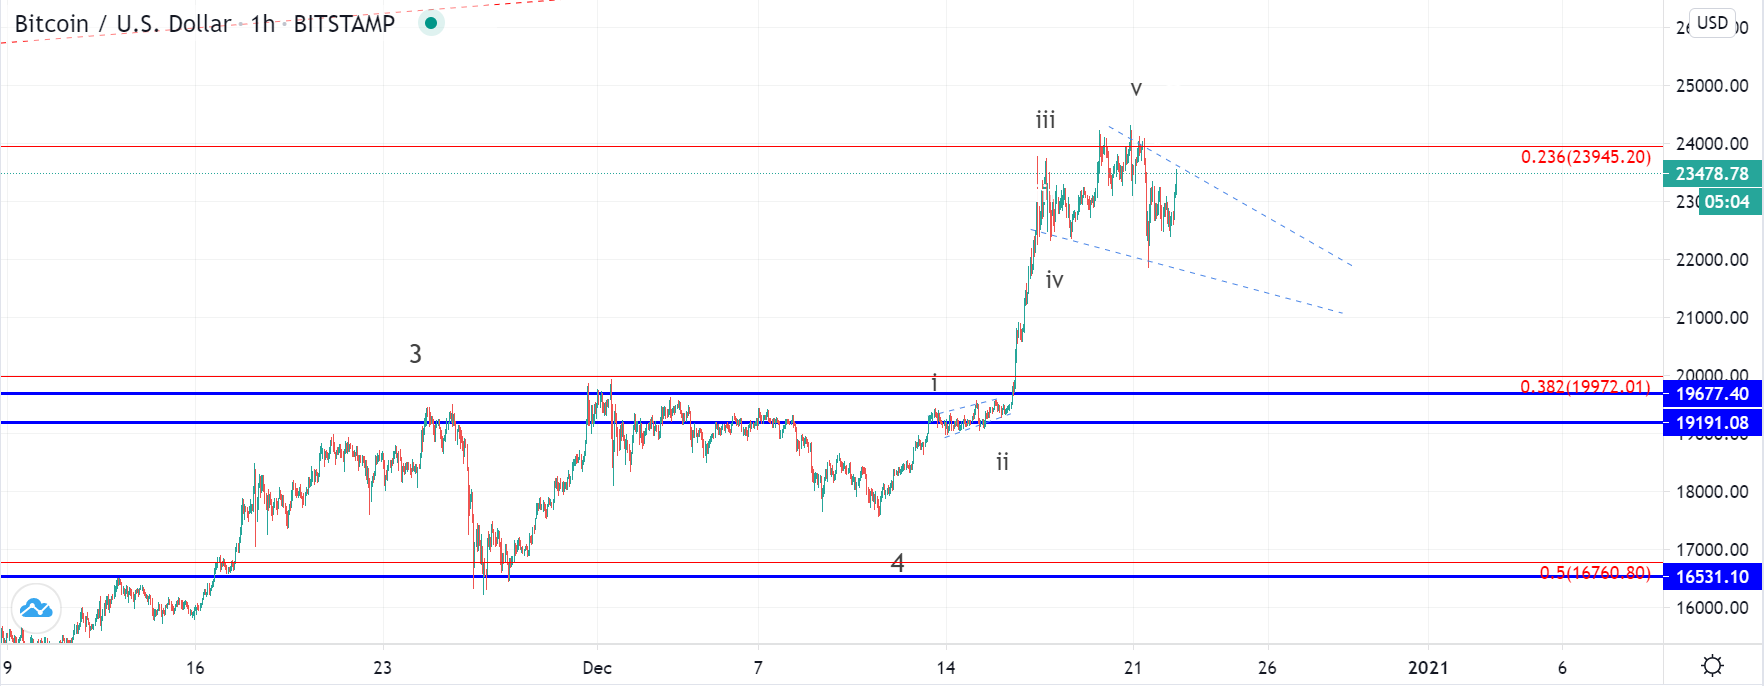
On the hourly chart, you can see that it came up in a five-wave manner from the 11th of December when it was sitting at $17,500 at its lowest point which was a higher low compared to the one made on the 26th of November.
This higher lower could have been the ending point of the corrective 4th wave from the higher degree in which case the price has formed now the 5th wave. In that case, we are now to see the start of the descending move, but another possibility would be that this higher low on the 11th was the 2nd sub-wave of the new higher degree impulse. If the second is true, then the five-wave impulse from the 11th is the 3rd wave which means that the current corrective structure is the 4th wave and that the price is going to continue increasing again after.
Now as the price is making a recovery we are going to see the validation of either scenario from its behavior. If it manages to exceed yesterday’s high it would indicate that another increase is going to the develop before the starting higher degree decline, but if finds resistance here and starts decreasing again it would mean that the increase ended.
XRP/USD
The price of Ripple has been in a decline from the 17th of December when it was sitting at $0.66413 and fell to $0.4509 today, which is a decrease of 32.1% but has since started making a minor recovery and is currently sitting at $0.4943.
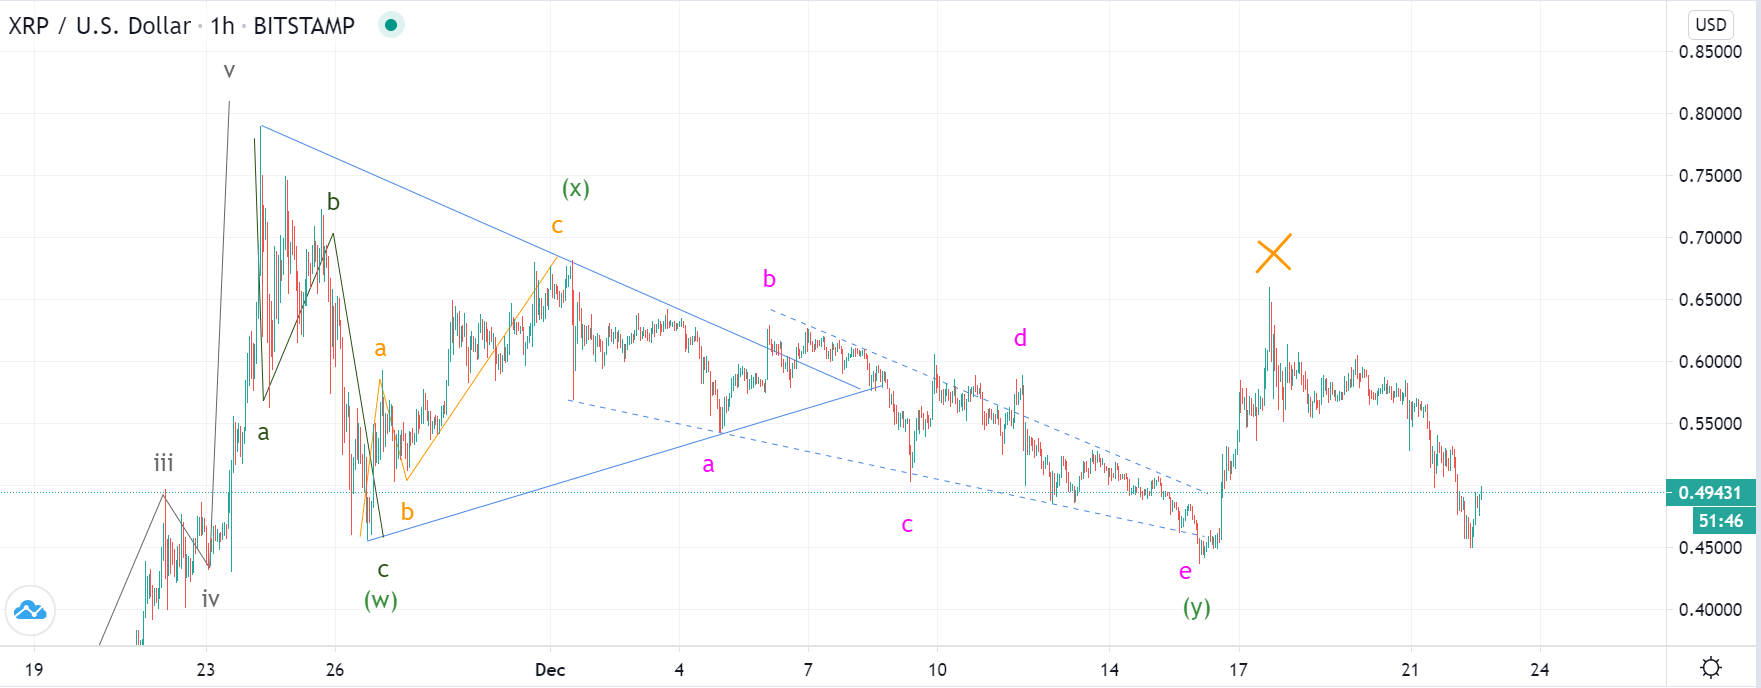
Looking at the hourly chart, we can see that the price made an impulsive rise after the completion of the descending triangle like expected and has broken out above the prior lower high. This was a bullish sign but however, it made it back to the same levels from which it started its upward trajectory.
This could indicate that the correction is still in place with the previous impulsive rise being the second wave X from the prolonged WXYXZ complex correction. If this is true then the price is now going to make another lower low for the development of the Z wave.
Another possibility could be that this is another starting five-wave impulse with the last decline being its 2nd sub-wave.
FXOpen offers the world's most popular cryptocurrency CFDs*, including Bitcoin and Ethereum. Floating spreads, 1:2 leverage — at your service (additional fees may apply). Open your trading account now or learn more about crypto CFD trading with FXOpen.
*Important: At FXOpen UK, Cryptocurrency trading via CFDs is only available to our Professional clients. They are not available for trading by Retail clients. To find out more information about how this may affect you, please get in touch with our team.
This article represents the opinion of the Companies operating under the FXOpen brand only. It is not to be construed as an offer, solicitation, or recommendation with respect to products and services provided by the Companies operating under the FXOpen brand, nor is it to be considered financial advice.
Stay ahead of the market!
Subscribe now to our mailing list and receive the latest market news and insights delivered directly to your inbox.


Latest articles

DAX 40: consolidation amid technology sell-off
A wave of selling in the technology sector that emerged earlier this week has weighed on European equities. The trigger was investor concern over the profitability of large-scale debt-funded investments by major US tech companies in AI infrastructure. The Nasdaq

Euro Hits Fresh Yearly Lows Amid Dovish ECB Signals
The euro remains under pressure following weak macroeconomic data from the euro area and fresh signals that the European Central Bank is prepared to maintain a more accommodative monetary policy stance. Data released yesterday pointed to a deterioration in business

Pound at Key Levels: Markets Assess Impact of Political Uncertainty in the UK
The British pound remains under pressure following increased political uncertainty in the United Kingdom triggered by the Prime Minister’s resignation. Investors are assessing potential shifts in the political and economic policy outlook after the head of government stepped down,