


FXOpen

BTC/USD
From yesterday’s low at $5883 the price of Bitcoin has increased by 11.3% as it came up to $6548 at it’s highest point today. Currently, the price is being traded slightly lower but has started to break out from the descending triangle on the upside which was formed after today’s high.
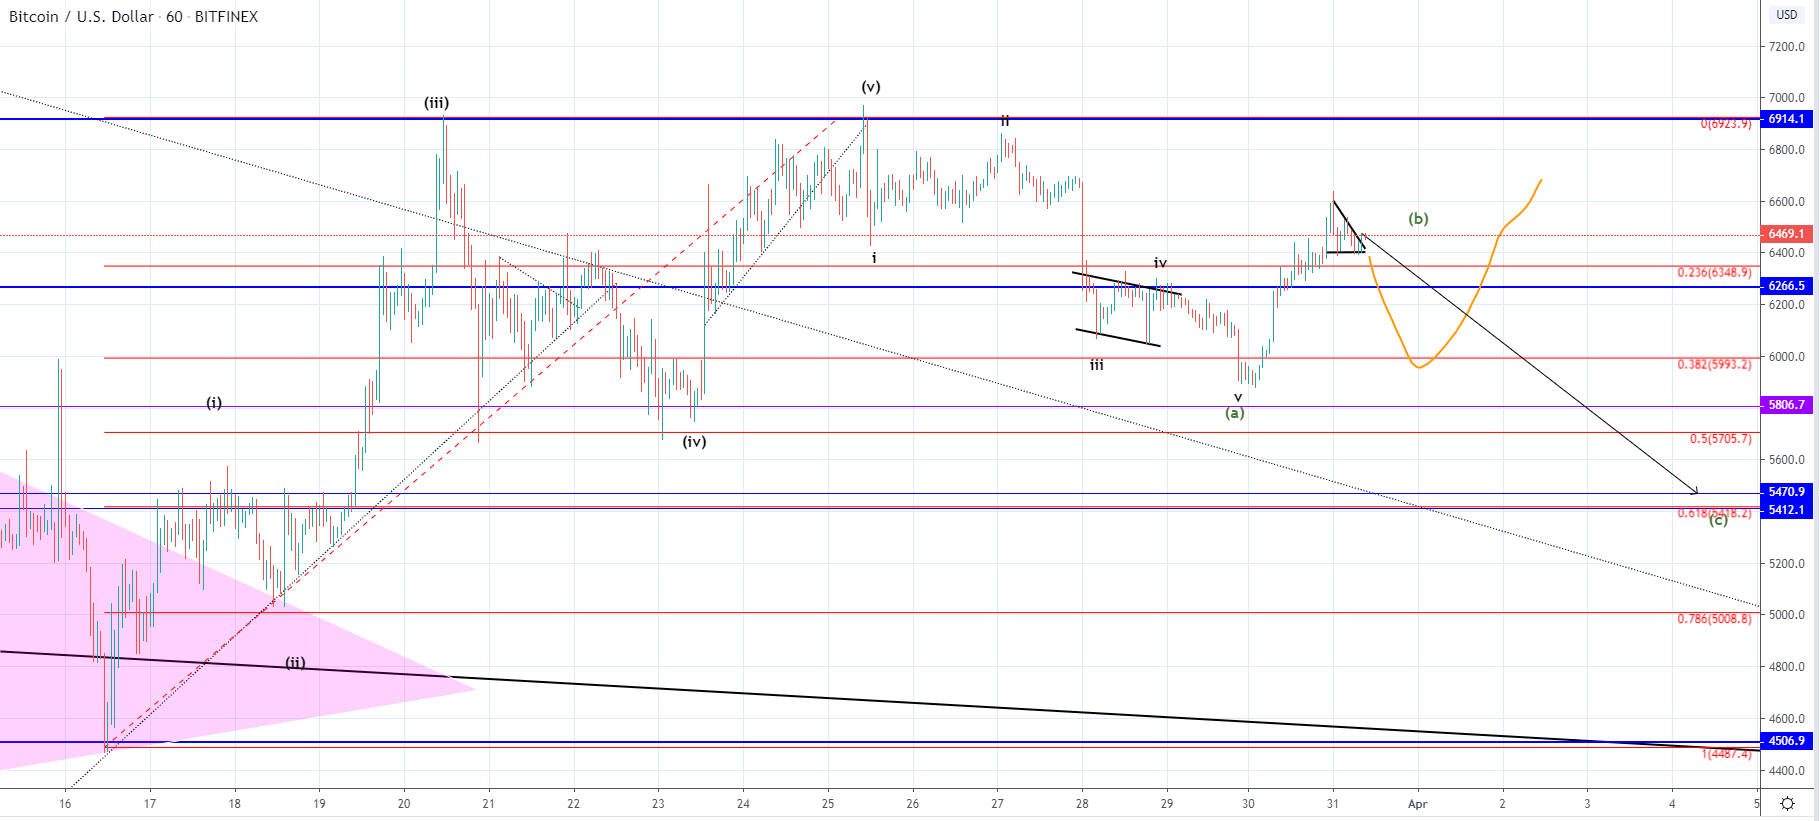 On the hourly chart, we can see that the price managed to come above the $6266 horizontal level which is a significant one but has now entered the seller’s territory and is experiencing pressure from their side. This rise of over 11% occurred after a five-wave move to the downside was seen which is why I believe it is corrective in nature and we are to see another five-wave move to the downside after it’s completion.
If that is true then it would develop and three-wave ABC Zigzag of a higher degree for which the C wave would come to around 0.618 Fib level at around $5420 which confirms the projected length of the presumed A wave on to the current ending point. Another possibility could be that the B wave hasn’t developed fully with the currently expected downside move being it’s second wave after which one more to the upside would start which is set to slightly exceed today’s high. This depends on the A wave’s sub-wave 5’s ending point, as if was like now labeled the B wave hasn’t ended, but if it ended on the descending channels support level at $6000 then the B wave ended with the expected downside move being it’s starting C wave.
XRP/USD
The price of Ripple has increased from yesterday’s low at $0.163 to $0.17619 which was an increase of around 8%. Since then we have seen a slight decrease but the price is still hovering above it’s significant support level.
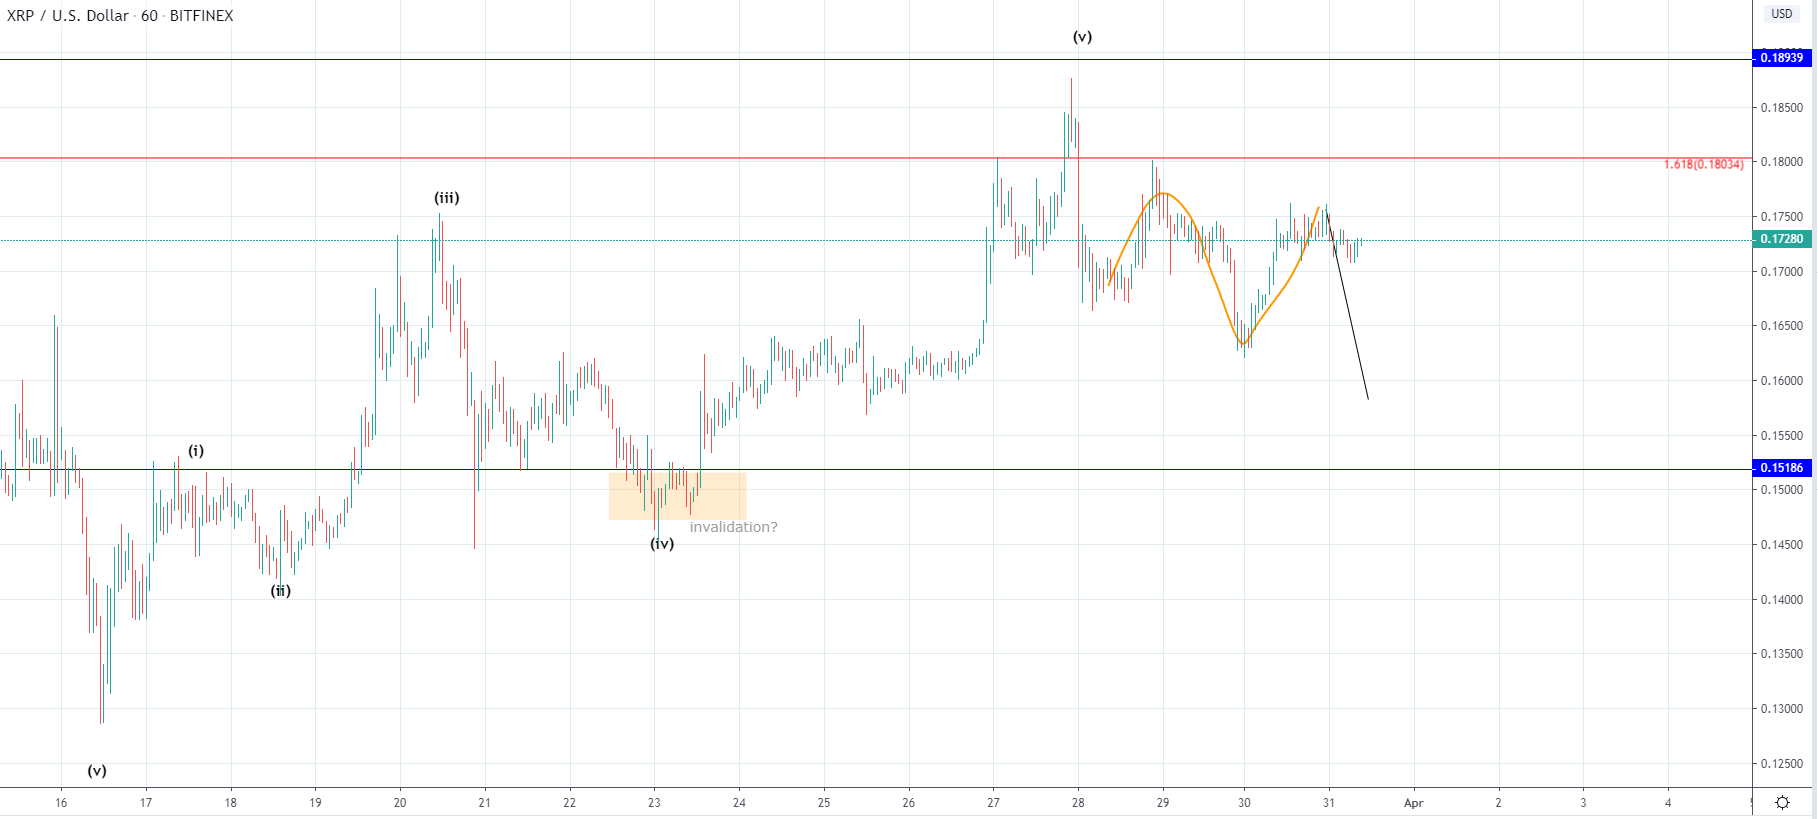 Looking at the hourly chart we can see that the price has been in an uptrend since the 16th of March when it came down to $0.129 at it’s lowest spike and from there made a five-wave increase of around 45.9%. This is why I believe we are seeing the start of the correction from the same degree out of which the current structure is its 2nd wave, B.
The move to the downside which is expected to start shortly would, in that case, be the C wave or the 3rd wave if the next move is another starting impulse to the downside, but in either way further decline would be anticipated to at least somewhere around the significant horizontal level at $0.152
FXOpen offers the world's most popular cryptocurrency CFDs*, including Bitcoin and Ethereum. Floating spreads, 1:2 leverage — at your service. Open your trading account now or learn more about crypto CFD trading with FXOpen.
*At FXOpen UK and FXOpen AU, Cryptocurrency CFDs are only available for trading by those clients categorised as Professional clients under FCA Rules and Professional clients under ASIC Rules respectively. They are not available for trading by Retail clients.
This article represents the opinion of the Companies operating under the FXOpen brand only. It is not to be construed as an offer, solicitation, or recommendation with respect to products and services provided by the Companies operating under the FXOpen brand, nor is it to be considered financial advice.
Stay ahead of the market!
Subscribe now to our mailing list and receive the latest market news and insights delivered directly to your inbox.

Latest articles

Weekly Market Wrap With Gary Thomson: Nasdaq, EUR/USD, USD/CHF, Brent Crude Oil, Googl Shares
Get the latest scoop on the week's hottest headlines, all in one convenient video. Join Gary Thomson, the COO of FXOpen UK, as he breaks down the most significant news reports and shares his expert insights.
- Nasdaq Composite: Worst Session

Analysis of AUD/USD: Exchange Rate Falls to Early May Low
As indicated by the 4-hour AUD/USD chart today:
→ the rate fell below 0.652, a level last seen on May 2;
→ the RSI indicator dropped below 15, a level last seen during the panic over the spread of COVID-19

Analysis of AMZN Stock: Price at 1.5-Month Low
As shown in the AMZN chart, the stock price dropped below:
→ the psychological level of $180;
→ the mid-June interim low.
The last time AMZN traded below $180 was in early June.
Thus, AMZN has faced sell-offs, similar to other tech