


BTC and XRP - Lower lows expected but a recovery is soon to start
FXOpen

BTC/USD
The price of Bitcoin has been stuck in a horizontal range since last Monday when it fell to $7758 with strong bearish momentum which is the support level of the mentioned range and retested the $8500 level which is its resistance. This horizontal range could be interpreted as a consolidative range after a breakout has been seen from the descending triangle but it is still unclear whether or no the price headed further to the downside from here or are we going to see the recovery starting soon. 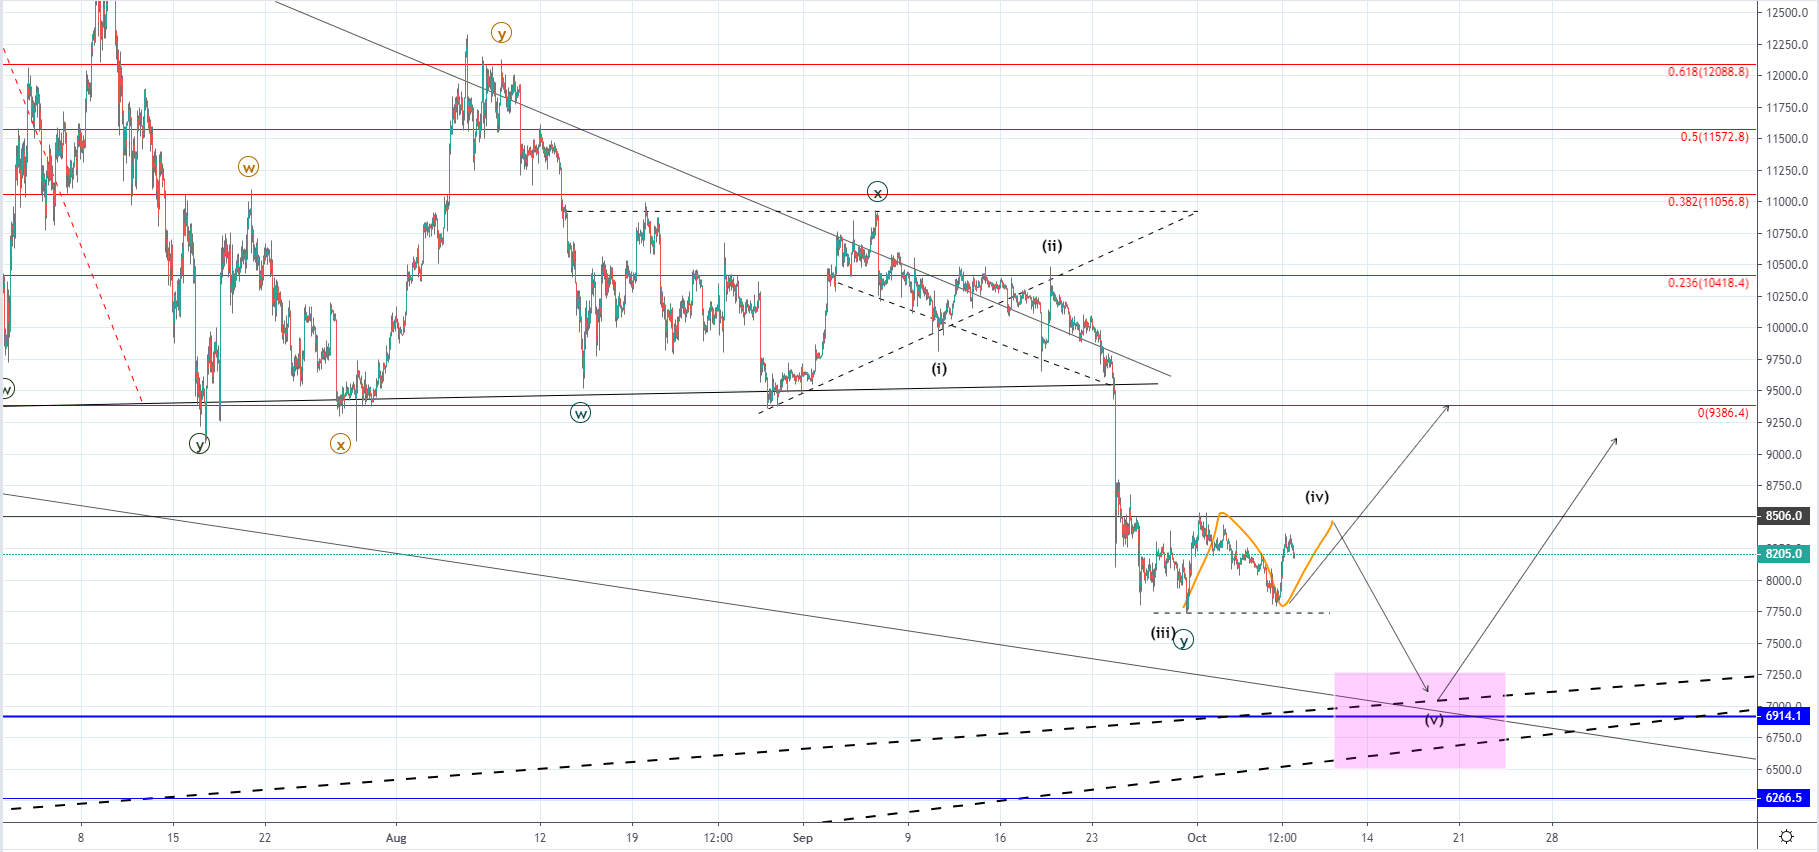 On the hourly chart, you can see that the price of Bitcoin made a three-wave move from the presumed X wave of the 3rd WXY correction. The downfall might have ended on the 3rd wave but considering the impulsiveness seen it more likely that we are in for another low as the price action could develop in a five-wave manner. If this is true then the currently seen range would be its 4th wave which is corrective in nature and will end as a retest of the broken $8500 support level.
If the decline continues it would most likely end at the highly significant support intersection of multiple ascending and horizontal levels around $7000. In either way, soon a trend reversal is expected to start from we are to see if the price has entered the longer-term downtrend or are we seeing the price continuing its upward movement.
XRP/USD
From yesterday’s open at $0.2535 the price of Ripple has increased by 11.88% as it came up today to $0.28528 at its highest point. Currently, the price is trading slightly lower as interaction has been made with the 0 Fib level which is the lower level of the significant horizontal support zone around $0.294.
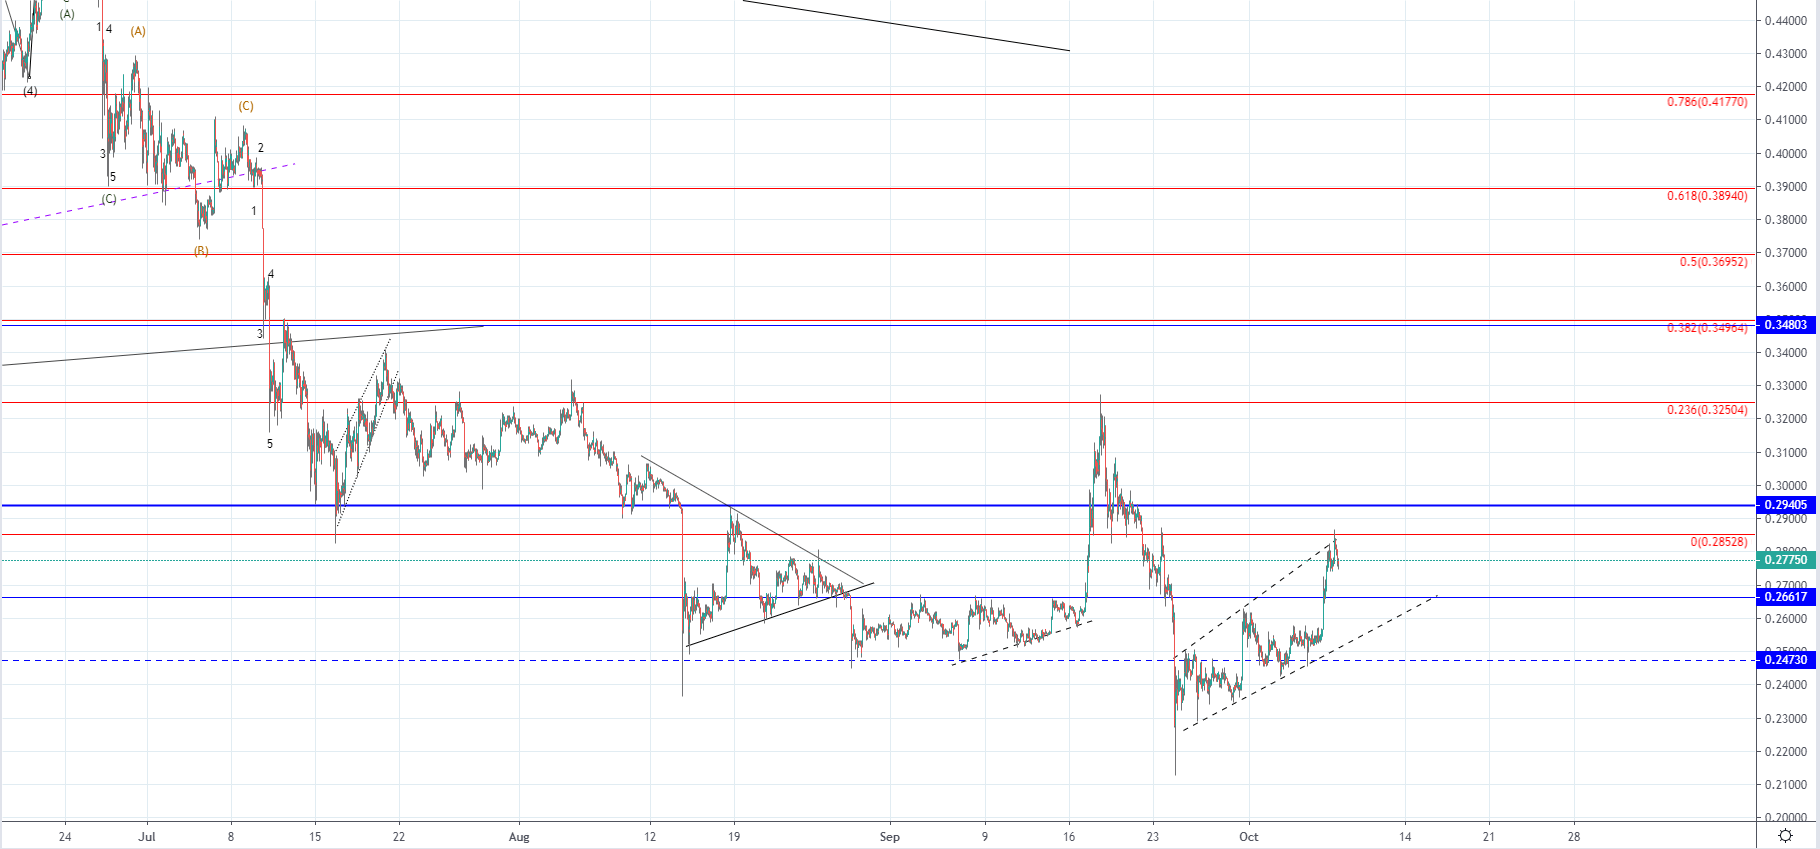
As you can see from the hourly chart, the price of Ripple has also reached the resistance level of the ascending channel which was formed from the prior low made on the 24th of September when the price dipped below the $0.2473 horizontal level. This implicates that now most likely we are to see a retracement back to either the support level of the descending channel or some of the significant horizontal support levels out of which the most recent one at $0.26617 would look more likely.
If the price continues increasing from here and manages to enter the upper range above the 0 Fib level and the $0.29405 support it would need to do so with strong momentum as the support zone now serves as strong resistance. This momentum has been shown since yesterday’s open but like the previous spike that ended in a downfall, we could be seeing another corrective ascending structure.
FXOpen offers the world's most popular cryptocurrency CFDs*, including Bitcoin and Ethereum. Floating spreads, 1:2 leverage — at your service (additional fees may apply). Open your trading account now or learn more about crypto CFD trading with FXOpen.
*Important: At FXOpen UK, Cryptocurrency trading via CFDs is only available to our Professional clients. They are not available for trading by Retail clients. To find out more information about how this may affect you, please get in touch with our team.
This article represents the opinion of the Companies operating under the FXOpen brand only. It is not to be construed as an offer, solicitation, or recommendation with respect to products and services provided by the Companies operating under the FXOpen brand, nor is it to be considered financial advice.
Stay ahead of the market!
Subscribe now to our mailing list and receive the latest market news and insights delivered directly to your inbox.


Latest articles

US Dollar Index: A Defining Week for the King of the Markets
The dollar heads into a pivotal week trading near 101.80, just off a 15-month high, with the Fed's July 29 meeting standing as the clear focal point. Markets currently price roughly a 65% chance of a hold, though renewed

NZD/USD: Inflation Surge Meets Strong US Dollar Pressure
On 21 July, Stats NZ reported an acceleration in inflation: the Consumer Price Index rose 1.5% in the second quarter, while the annual inflation rate climbed to 4.1%, its highest level in more than two years and slightly

Weekly Market Insights with Gary Thomson: The Week of Central Banks and Earnings
In this video, we’ll explore the key economic events and market trends, shaping the financial landscape. Get ready for insights into financial markets to help you navigate the week ahead. Let’s dive in!
In this episode of Market