


BTC/USD and XRP/USD in a sideways movement
FXOpen
BTC/USD
From January 1st when the price of Bitcoin was $3797 at its lowest the cryptocurrency price has increased. BTC/USD is currently trading at around $4140 which is an increase of 9%. The price went further up since the start of the year and was $4218 at its highest point so far on Sunday.
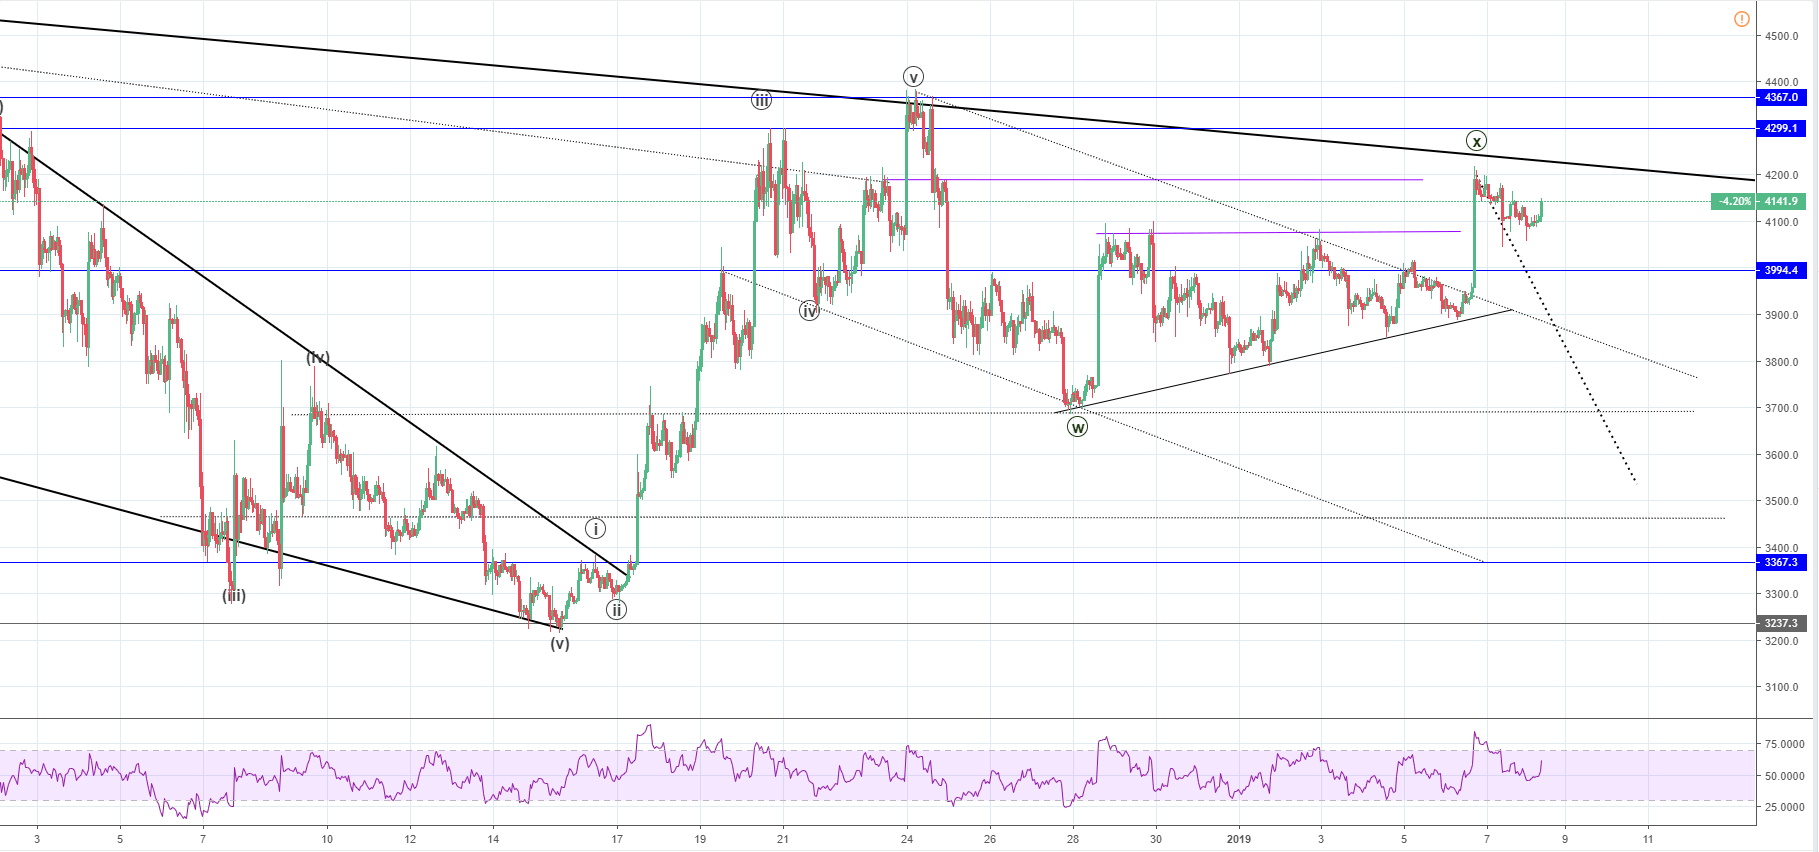
On the hourly chart, the price action has created a triangle, and the price has broken out from it on Sunday when it reached $4218 making it the yearly high so far. The BTC/USD pair broke the horizontal resistance at around $4000 as well a minor one at $4081 (the prior two highs level). The BTC price also broke the descending channel formed since the price reached the bold black line. As the cryptocurrency moved close to the black bold line, the significant downtrend support, it’s likely going to retest the level from the downside again.
The price is in an upward trajectory again. The pair is checking if the second horizontal resistance (purple line) is strong enough to withhold the momentum as it did last time when the price interacted with the level but bounced and pushed the price down for a retracement. I have labeled the current price action structure as the X wave. The second corrective wave from the WXY correction will likely develop after an impulsive move to the upside.
After it ends, a pullback is expected. The Y wave should start developing which means that more downside is expected from the current levels. According to RSI, the price strength is above mid range which means that the price could go either up or down from here. This fits perfectly with my Elliott Wave count as the expected short-term price action movement is likely going to be sideways for a while now.
Projecting the W wavelength from the current level we come up with the target price of around $3540. The price might get lower than that as it might go all the way down to the horizontal support at $3367 for a retest.
XRP/USD
On January 1st the price of Ripple was $0.35873 at its lowest point. Since then the price was in a sideways movement and has gone up to $0.39105 at its highest point so far. Afterward, the Ripple fell to the year’s low again. This continued on for another time when the price again started increasing but it came up slightly lower than the last time, coming to $0.38418 before going down again.
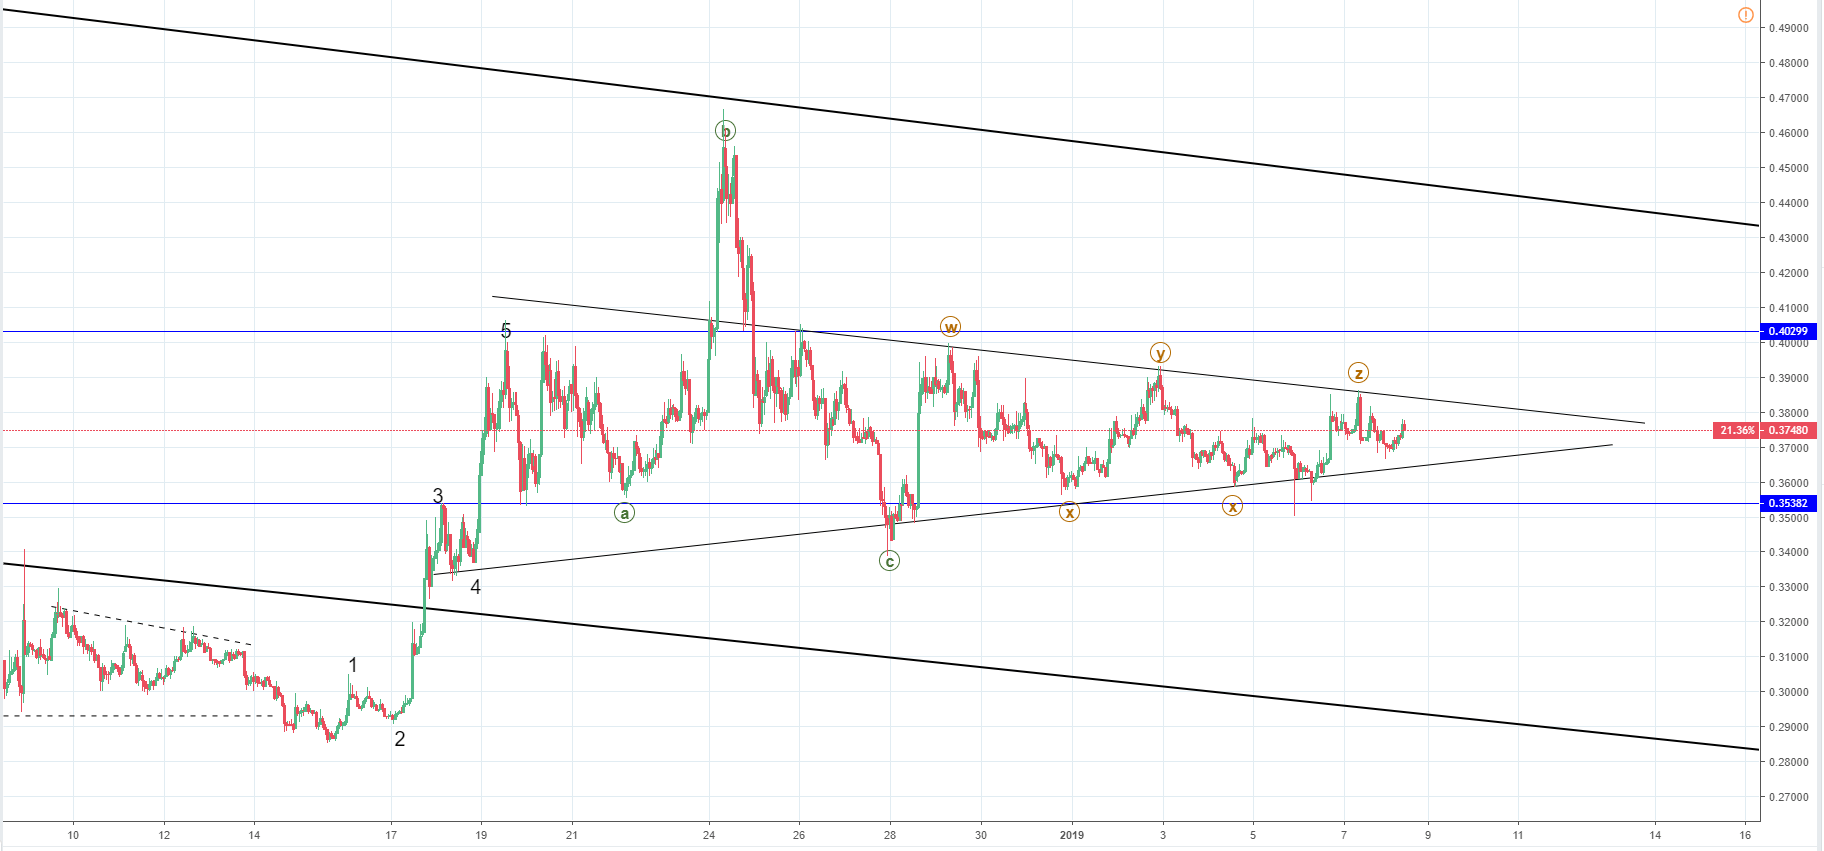 On the hourly chart, the price action has formed a symmetrical triangle and judging by Elliott Wave count we are going to see a breakout from the downside as the current corrective wave ends on the upside. This might not happen straight away since another correction might take place. But even if it did I would expect it to go to the horizontal support level at $0.35382 which is the lower line from the support range the price is currently trading at.
The XRP/USD price is also in a descending channel since September 21st so I am looking for an interaction with the outline levels again. The current market conditions show us that we are going to see an interaction with the upper levels before another depreciation in price and further downside.
Thus, we are most likely going to see a minor retracement to the lower horizontal support level. After that, another increase is expected to the upper bold black line which is the descending channels resistance line. Then a rejection will occur and we are going to see further downside for the price of Ripple.
FXOpen offers the world's most popular cryptocurrency CFDs*, including Bitcoin and Ethereum. Floating spreads, 1:2 leverage — at your service (additional fees may apply). Open your trading account now or learn more about crypto CFD trading with FXOpen.
*Important: At FXOpen UK, Cryptocurrency trading via CFDs is only available to our Professional clients. They are not available for trading by Retail clients. To find out more information about how this may affect you, please get in touch with our team.
This article represents the opinion of the Companies operating under the FXOpen brand only. It is not to be construed as an offer, solicitation, or recommendation with respect to products and services provided by the Companies operating under the FXOpen brand, nor is it to be considered financial advice.
Stay ahead of the market!
Subscribe now to our mailing list and receive the latest market news and insights delivered directly to your inbox.


Latest articles

DAX 40: consolidation amid technology sell-off
A wave of selling in the technology sector that emerged earlier this week has weighed on European equities. The trigger was investor concern over the profitability of large-scale debt-funded investments by major US tech companies in AI infrastructure. The Nasdaq

Euro Hits Fresh Yearly Lows Amid Dovish ECB Signals
The euro remains under pressure following weak macroeconomic data from the euro area and fresh signals that the European Central Bank is prepared to maintain a more accommodative monetary policy stance. Data released yesterday pointed to a deterioration in business

Pound at Key Levels: Markets Assess Impact of Political Uncertainty in the UK
The British pound remains under pressure following increased political uncertainty in the United Kingdom triggered by the Prime Minister’s resignation. Investors are assessing potential shifts in the political and economic policy outlook after the head of government stepped down,