


BTC/USD and XRP/USD: more upside expected
FXOpen
BTC/USD
From the start of the week, the price of Bitcoin was in an upward trajectory and has come from yesterday’s open at $3580 to $3801 at its highest point yesterday. Since yesterday’s high, the price has been retracing and is currently sitting at $3729, which is an overall increase of 4.07%.
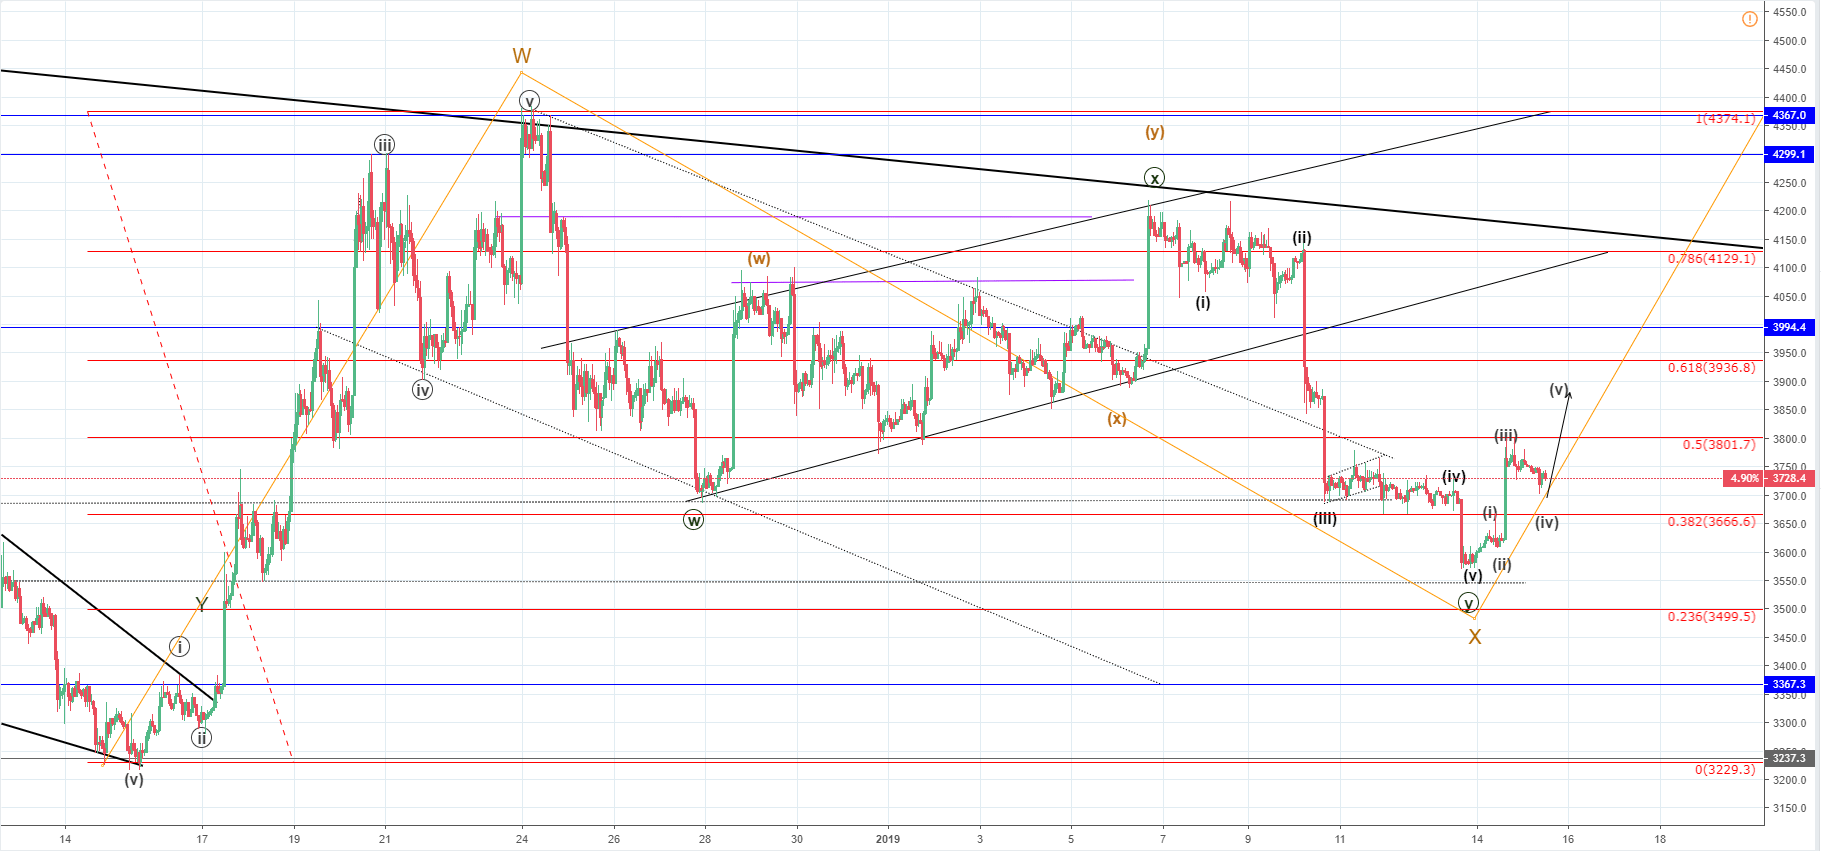
Looking at the hourly chart you can see that the price action has created a minor descending channel in which the price is retracing from the moment it hit the 0.5 Fibonacci level. As the wave structure looks impulsive, I believe that the move to the upside has one more wave to go. That is why after the retracement I would expect the price of Bitcoin to go up to $3880 before this move has ended.
The retracement could end on the 0.382 Fibonacci level, which would mean that the price could go further down to $3666 before increasing for another 5-6% measured to the $3880 level, but the price could increase further potentially all the way up to $3994.4 horizontal resistance before this move has ended.
Looking at the Elliott Wave labelings you can see that price is in the second stage X of the Minor WXY (orange), which means that if the X wave has ended on the Y wave of the Minute WXY (dark green), we are now seeing the start of the third Y wave impulsive move to the upside, which could push the price of Bitcoin higher than the previous high at $4367. But the Minute WXY might get prolonged by two more waves, which could mean that the current Minuette 12345 move to the upside is the second wave X and that another Z wave to the downside is to develop afterward.
XRP/USD
From yesterday’s open, when the price of Ripple was at $0.3215 the price has increased by 4.85% as its currently sitting at $0.33697. The price went higher yesterday and reached $0.348 at the highest point when it spiked up from $0.3261, but since the high, the price has been pulling back steadily.
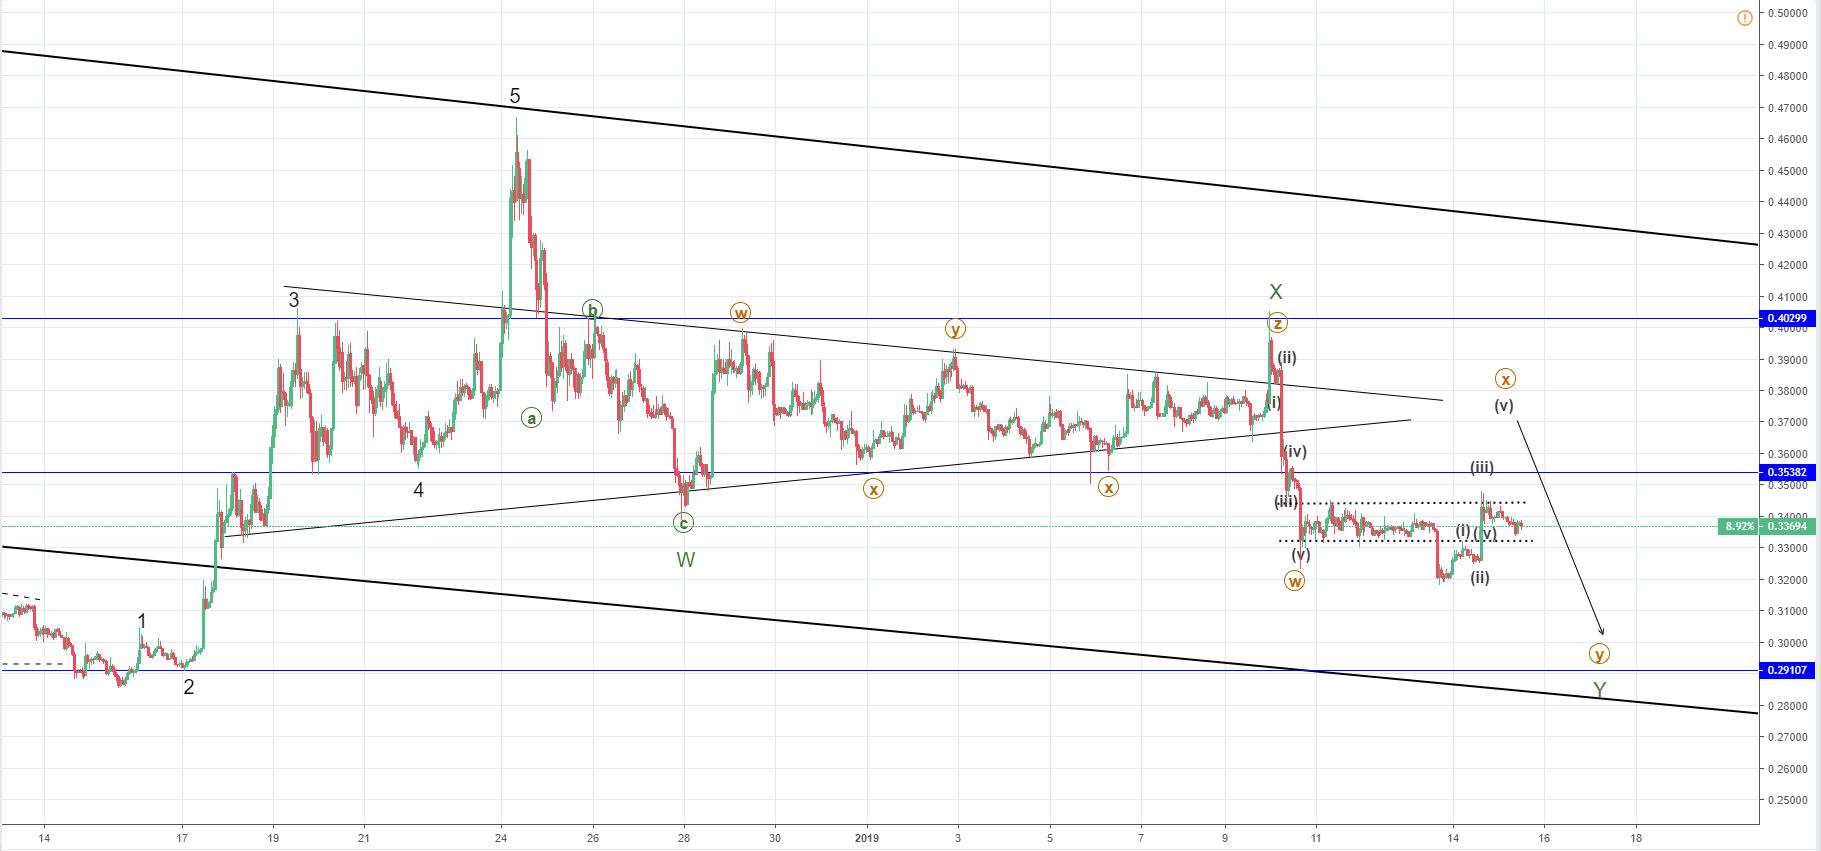
On the hourly chart you can see that the price has spiked to the minor horizontal resistance level from the prior range and came back, closing the hourly candles below it. The price still hasn’t reached the lower level of the prior range. That is why I expect it to go a bit lower even though a minor interaction did happen before continuing its upward trajectory again. As the upward move looks impulsive I would expect another increase from here to the resistance line of the next range $0.35382 at least to $0.37 at max.
But when the increase ends I would be expecting to see more downside for the price of Ripple as the current move is most likely a corrective wave to the upside before a continuing for another downside move, which would be the end the Minor Y wave.
FXOpen offers the world's most popular cryptocurrency CFDs*, including Bitcoin and Ethereum. Floating spreads, 1:2 leverage — at your service (additional fees may apply). Open your trading account now or learn more about crypto CFD trading with FXOpen.
*Important: At FXOpen UK, Cryptocurrency trading via CFDs is only available to our Professional clients. They are not available for trading by Retail clients. To find out more information about how this may affect you, please get in touch with our team.
This article represents the opinion of the Companies operating under the FXOpen brand only. It is not to be construed as an offer, solicitation, or recommendation with respect to products and services provided by the Companies operating under the FXOpen brand, nor is it to be considered financial advice.
Stay ahead of the market!
Subscribe now to our mailing list and receive the latest market news and insights delivered directly to your inbox.


Latest articles

EUR/USD Eyes Gains As USD/CHF Weakness Deepens Again
EUR/USD started a fresh increase above 1.1700 and 1.1720. USD/CHF declined further and is now struggling below 0.7835.
Important Takeaways for EUR/USD and USD/CHF Analysis Today
· The Euro started a decent increase from

Apple: Earnings Day Above the Activity Zone
On 30 April, after the market close, Apple Inc. will release its financial results for the second quarter of fiscal 2026. The consensus forecast, based on estimates from 31 analysts, points to revenue of around $109.7 billion, with expected

USD/JPY and USD/CHF Near Key Levels: The Dollar Supported by the Fed
The US dollar continues to trend upwards following the Federal Reserve meeting, drawing support from the regulator’s moderately hawkish stance and comments by Jerome Powell. Markets interpret the Fed’s rhetoric as a signal that restrictive policy is likely