


BTCUSD and XRPUSD Technical Analysis – 01st NOV 2022
FXOpen

BTCUSD: Inverted Hammer Pattern Above $19187
Bitcoin was unable to sustain its bearish momentum and after touching a low of 19187 on 24th Oct, the prices started to correct upwards crossing the $20500 handle.
We can see continued appreciation in the price of BTCUSD which is now trading above the 20500 in the European trading session today.
We can see the formation of a bullish harami pattern in the 30-minute time frame.
The resistance of the channel is broken in the 1-hourly time frame indicating the bullish tone of the markets.
We can clearly see an inverted hammer pattern above the $19187 handle which is a bullish reversal pattern because it signifies the end of a downtrend and a shift towards an uptrend.
Bitcoin touched an intraday low of 20379 in the Asian trading session and an intraday high of 20657 in the European trading session today.
Both the STOCH and STOCHRSI are indicating overbought levels which means that in the immediate short term, a decline in the price is expected.
The relative strength index is at 53 indicating a NEUTRAL demand for bitcoin and a shift towards the consolidation phase in the markets.
Bitcoin is now moving above its 100 hourly exponential moving average and above its 200 hourly exponential moving averages.
Most of the major technical indicators are giving a STRONG BUY signal, which means that in the immediate short term, we are expecting targets of 21000 and 21500.
The average true range is indicating LESS market volatility with a mildly bullish momentum.
- Bitcoin: bullish reversal seen above $19187.
- The Williams percent range is indicating an overbought level.
- The price is now trading just below its pivot level of $20607.
- Most of the moving averages are giving a STRONG BUY market signal.
Bitcoin: Bullish Reversal Seen Above $19187
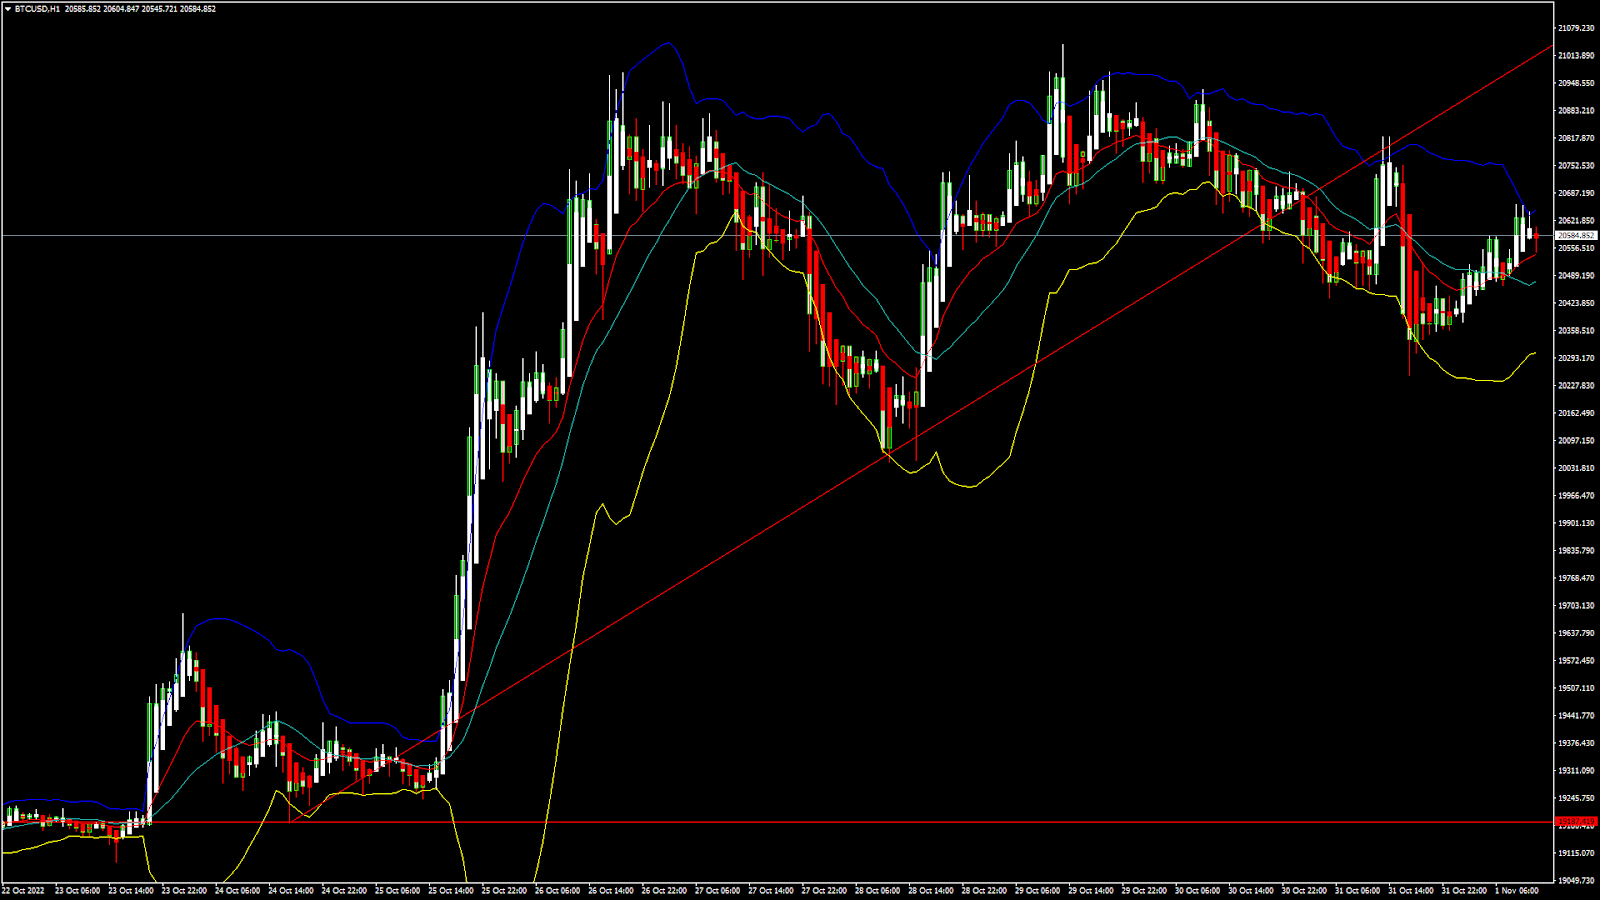
We can now see that the price of bitcoin rocketed higher recently towards the monthly high of 20969 on 29th Oct, and we can now witness the formation of an ascending channel in the markets.
Bitcoin’s price is super bullish against the US dollar and bitcoin and now we are aiming towards crossing the $21000 and $22000 levels soon.
The adaptive moving average AMA20 and AMA50 are giving a bullish trend reversal signal.
The price of bitcoin is back over the pivot point in the daily time frame indicating the bullish overtone present in the markets.
We have also seen a bullish opening of the markets this week.
The immediate short-term outlook for bitcoin is strongly bullish, the medium-term outlook has turned bullish, and the long-term outlook remains neutral under present market conditions.
Bitcoin’s support zone is located at $19637 which is a 50% retracement from a 4-week high/low and the price needs to remain above this level for the continuation of the bullish reversal in the markets.
The price of BTCUSD is now facing its classic resistance level of 20628 and Fibonacci resistance level of 20667 after which the path towards 21500 will get cleared.
In the last 24hrs, BTCUSD has increased by 0.25% by 51$ and has a 24hr trading volume of USD 45.266 billion. We can see an increase of 39.05% in the trading volume compared to yesterday, which is due to the heavy buying pressure seen in the global markets.
The Week Ahead
The price of bitcoin is moving in a strongly bullish zone above the $20500 levels. Further upsides are projected at $21500 and $22000 as the immediate targets.
Now we are aiming for $21710 which is a 50% retracement from 13 week high/low.
The daily RSI is printing at 59 which indicates a strong demand for bitcoin and the continuation of the buying pressure in the markets.
The price of BTCUSD will need to remain above the important support level of $20000 this week.
The weekly outlook is projected at $21500 with a consolidation zone of $22000.
Technical Indicators:
The moving averages convergence divergence MACD (12,26): is at 6.20 indicating a BUY.
The commodity channel index CCI (14): is at 138.28 indicating a BUY.
The rate of price change ROC: is at 1.22 indicating a BUY.
Bull/bear power (13): is at 128.67 indicating a BUY.
XRPUSD: Hammer Pattern Above 0.4435
Ripple was unable to sustain its bearish momentum and after touching a low of 0.4435 on 25th Oct, the price started to bounce upwards touching a high of 0.4836 on 29th Oct.
We can see that the price of Ripple continues to move in a narrow range and is poised to break upwards towards the 0.5000 handle.
We can see the formation of a bullish harami cross pattern in the 15-minute time frame.
The MACD has crossed up its moving average in the 4-hour time frame indicating the bullish nature of the markets.
We can clearly see a hammer pattern above the 0.4435 handle which is a bullish reversal pattern because it signifies the end of a downtrend and a shift towards an uptrend.
Ripple touched an intraday low of 0.4542 in the Asian trading session and an intraday high of 0.4672 in the European trading session today.
We can see that the price of Ripple continues to remain under pressure despite being in a bullish trend. This indicates weak investor sentiment in the short time frame.
The relative strength index is at 54 which signifies a neutral demand for Ripple at the current market prices and the continuation of the consolidation phase in the markets.
Most of the moving averages are giving a BUY signal at the current market levels of 0.4617
Ripple is now trading below its pivot level of 0.4618 and facing its classic resistance level of 0.4634 and Fibonacci resistance level of 0.4643 after which the path towards 0.4800 will get cleared.
Most of the major technical Indicators are giving a STRONG BUY signal.
- Ripple: bullish reversal seen above the 0.4435 levels.
- High/low are indicating neutral levels.
- The average true range indicates LESS volatility.
- Ripple gains bullish bias against the US dollar.
Ripple Bullish Reversal Seen Above 0.4435

We can see that the price of Ripple continues to remain in a consolidation phase, and now we are aiming to cross the 0.5000 handle this week.
The relative strength index is back over 50 indicating the bullish nature of the markets.
We can see the formation of a bearish harami pattern in the 1-hour time frame.
We can see a bullish price crossover pattern with adaptive moving average AMA50.
The short-term outlook for Ripple has turned mildly bullish, the medium-term outlook is neutral, and the long-term outlook is neutral under present market conditions.
We can see the formation of the ichimoku bullish crossover pattern tenkan and kijun.
The price of XRPUSD has decreased by 0.06% with a price change of $0.0002913 in the past 24hrs and has a trading volume of 1.428 billion USD.
We can see an increase of 26.92% in the trading volumes of Ripple compared to yesterday, which appears to be normal.
This Week Ahead
The price of Ripple is correcting higher against the US dollar and bitcoin. XRP/USD is staging an upwards recovery this week and testing the resistance levels of $0.5100.
The immediate support levels are located at 0.4360 which is a 50% retracement from 4-week high/low.
We can see a continuous progression of a bullish trend line formation from 0.4435 towards the 0.4831 levels.
The weekly outlook for Ripple is projected at 0.4800 with a consolidation zone of 0.5100.
Technical Indicators:
The STOCHRSI (14): is at 61.91 indicating a BUY.
The moving averages convergence divergence MACD (12,26): is at .001 indicating a BUY.
Bull/bear power (13): is at 0.0037 indicating a BUY.
The rate of price change ROC: is at 1.816 indicating a BUY.
FXOpen offers the world's most popular cryptocurrency CFDs*, including Bitcoin and Ethereum. Floating spreads, 1:2 leverage — at your service (additional fees may apply). Open your trading account now or learn more about crypto CFD trading with FXOpen.
*Important: At FXOpen UK, Cryptocurrency trading via CFDs is only available to our Professional clients. They are not available for trading by Retail clients. To find out more information about how this may affect you, please get in touch with our team.
This article represents the opinion of the Companies operating under the FXOpen brand only. It is not to be construed as an offer, solicitation, or recommendation with respect to products and services provided by the Companies operating under the FXOpen brand, nor is it to be considered financial advice.
Stay ahead of the market!
Subscribe now to our mailing list and receive the latest market news and insights delivered directly to your inbox.


Latest articles

Nasdaq 100: Is This the Correction Traders Have Been Waiting For?
The Nasdaq 100 (US Tech 100 Mini on FXOpen) remains caught between two opposing forces: cooling inflation on one side, and persistent geopolitical instability on the other. On 14 July, June's CPI print came in softer than expected, easing near-term

XRP/USD: Symmetrical Triangle Forms as Trading Volume Fades
On 6 July, Ripple received a full Crypto-Asset Service Provider (CASP) licence under the Markets in Crypto-Assets (MiCA) regulation from Luxembourg's financial regulator, the CSSF. The approval allows the company to offer regulated crypto payment services across all 30 countries

AI Valuations Are Back in the Spotlight
Artificial intelligence remains the dominant investment theme of 2026, but investors are increasingly questioning whether AI stock valuations are keeping pace with reality.
💰 Big Tech continues to invest at an unprecedented scale, with hyperscaler AI spending projected to exceed $800