


BTCUSD and XRPUSD Technical Analysis – 02nd AUG 2022
FXOpen

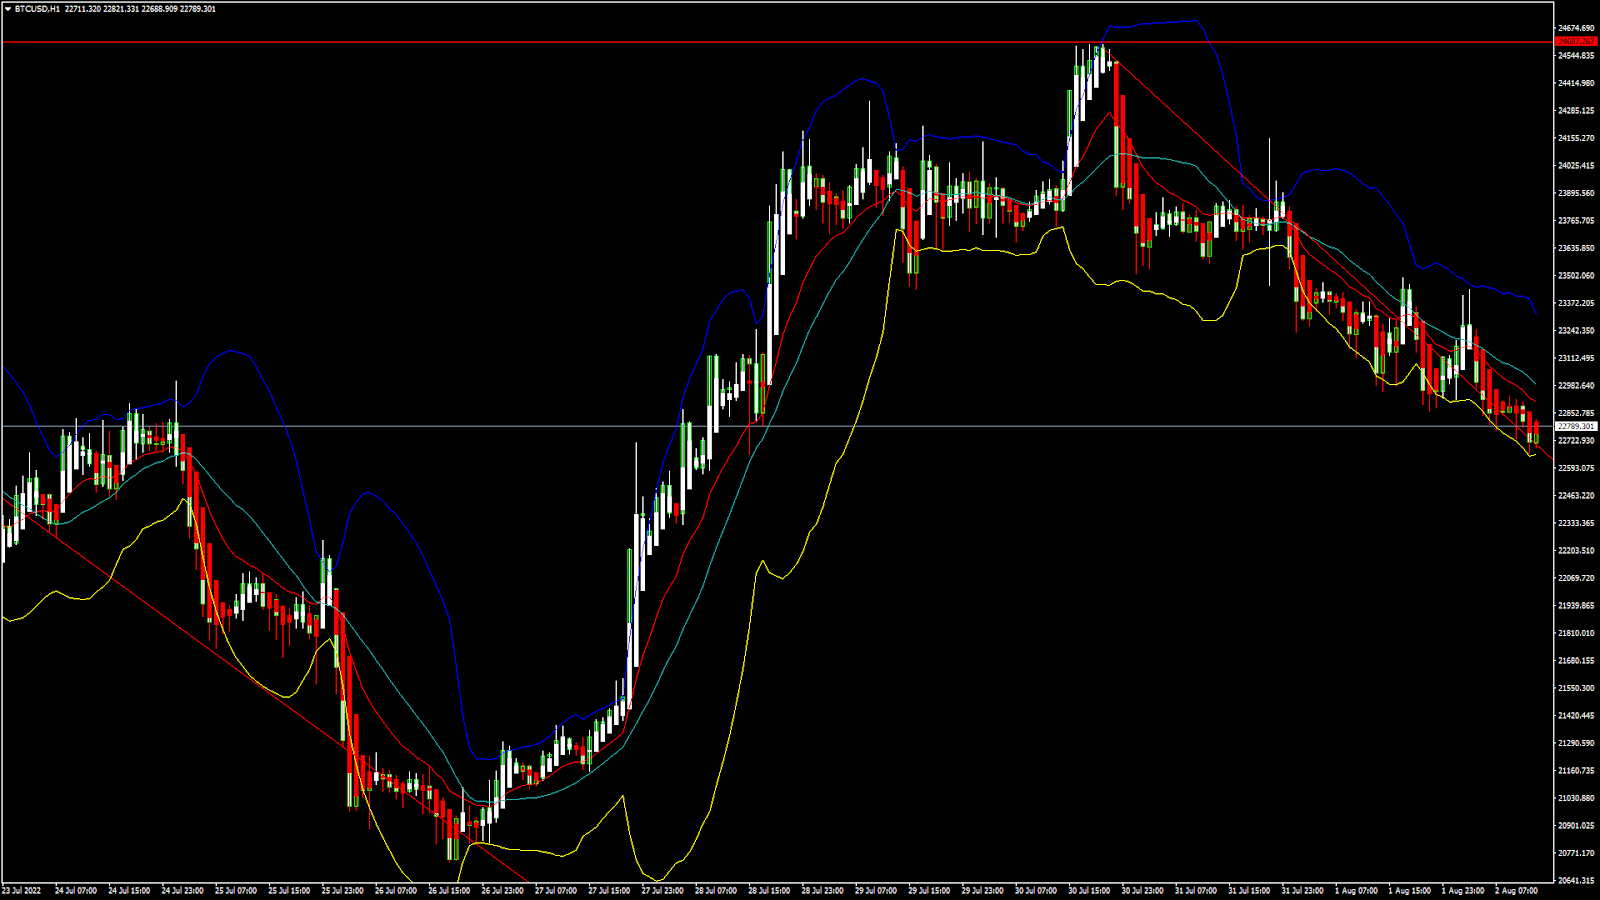
BTCUSD: Evening Star Pattern Below $24607
Bitcoin was unable to sustain its bullish momentum and after touching a high of 24597 on 30th July started to decline against the US dollar dropping below the $2300 handle in the European trading session today.
We can see that after this decline the prices have entered into a consolidation zone above the $22500 handle.
The prices have started to move in a descending trend channel due to the decrease in the demand and the continued selling across the global crypto markets.
We can clearly see a bearish evening star pattern below the $24607 handle which is a bearish reversal pattern because it signifies the end of an uptrend and a shift towards a downtrend.
Bitcoin touched an intraday high of 23438 in the Asian trading session and an intraday low of 22670 in the European trading session today.
Both the STOCH and Williams percent range are indicating overbought levels which means that in the immediate short term, a decline in the prices is expected.
The relative strength index is at 37 indicating a weaker demand for bitcoin at the current market levels and the continuation of the selling pressure in the markets.
Bitcoin is now moving below its 100 hourly simple moving average and its 200 hourly simple moving averages.
Most of the major technical indicators are giving a strong sell signal, which means that in the immediate short term, we are expecting targets of 22000 and 21500.
The average true range is indicating lesser market volatility with a bearish momentum.
- Bitcoin: bearish reversal seen below $24607
- STOCHRSI is indicating an oversold level
- The price is now trading just above its pivot level of $22747
- All of the moving averages are giving a strong sell market signal
Bitcoin: Bearish Reversal Seen Below $24607
The price of bitcoin continues to decline below the $23000 handle, and we are now testing the important support level of $22000 in the European trading session.
The global sentiments continue to remain weak and we can see more downwards correction this week towards the $21500 level.
Bitcoin was unable to clear its resistance zone located at $25000, and now we can see a progression of the bearish bias in the markets.
We can see the formation of a bearish harami pattern in the weekly time frame indicating the underlying bearish nature of the markets.
The immediate short-term outlook for bitcoin is bearish, the medium-term outlook has turned neutral, and the long-term outlook remains neutral under present market conditions.
Bitcoin’s support zone is located at $21000, and the prices continue to remain above these levels for any potential bullish reversal in the markets.
The price of BTCUSD is now facing its classic support level of 22500 and Fibonacci resistance levels of 22687 after which the path towards 2000 will get cleared.
In the last 24hrs, BTCUSD has declined by 1.70% by 394$, and has a 24hr trading volume of USD 27.922 billion. We can see an increase of 20.09% in the trading volume as compared to yesterday, which is due to the selling seen by the short-term investors.
The Week Ahead
The price of bitcoin is moving in a mildly bearish momentum, and the immediate targets are $22000 and $21500
The daily RSI is printing at 52 which indicates a neutral market and the move towards the consolidation channel.
The trendline formation is seen from the $24600 level towards $22600 indicating that if this bearish trend line gets exhausted, we may see an upwards correction in the prices.
Bitcoin’s price may continue to remain in a range-bound movement between the $22000 and $23000 levels this week.
The prices of BTCUSD will need to remain above the important support level of $21000 this week.
The weekly outlook is projected at $22000 with a consolidation zone of $21000.
Technical Indicators:
The average directional change (14 days): at 27.18 indicating a SELL
The rate of price change: at -1.38 indicating a SELL
The relative strength index (14): at 38.82 indicating a SELL
The commodity channel index (14 days): at -91.53 indicating a SELL
XRPUSD: Three Black Crows Pattern Below 0.4095
Ripple was unable to sustain its bullish momentum and after touching a high of 0.4096 on 30th July started to decline against the US dollar.
We can see a continuous decline in the price of Ripple due to increased selling by the short-term investors.
Now we are testing the important support zone located at 0.3700 which if broken will lead to Ripple touching the level of 0.3500.
We can clearly see a three black crows pattern below the 0.4095 handle which is a bearish reversal pattern because it signifies the end of an uptrend and a shift towards a downtrend.
Ripple touched an intraday high of 0.3939 in the Asian trading session and an intraday low of 0.3674 in the European trading session today.
Both the STOCH and Williams percent range are indicating oversold levels which means that in the immediate short term, an upwards correction in the prices is expected.
The relative strength index is at 41 which signifies a weaker demand for Ripple at the current market prices and the continuation of the decline.
Most of the moving averages are giving a strong sell signal at the current market level of 0.3710.
Ripple is now trading just above its pivot level of 0.3686 and facing its classic support level of 0.3637 and Fibonacci support level of 0.3674 after which the path towards 0.3500 will get cleared.
Most of the major technical indicators are giving a strong sell signal.
- Ripple: bearish reversal seen below the 0.4095 level
- The average directional change is indicating a neutral level
- The average true range indicates high market volatility
- Ripple gains bearish bias against the US dollar
Ripple: Bearish Reversal Seen Below 0.4095

We can see that the price of Ripple continues to move downwards with the formation of a bearish trendline, now trading below the 0.3800 handle in the European trading session today.
The prices of Ripple are forming a bearish descending trendline below the 0.3800 level, and a continued progression is seen towards the 0.3585 levels.
The short-term outlook for Ripple has turned bearish, the medium-term outlook is neutral, and the long-term outlook is neutral under present market conditions.
We can see that Ripple was unable to clear its resistance zone located at 0.4100, and now the price is struggling to retain the bullish bias against the US dollar.
We have also detected the formation of MA5 exponential crossover pattern located at 0.3700 which indicates that we may see a short-term upwards correction in the prices.
The price of XRPUSD has decreased by 1.21% with a price change of $0.004539 in the past 24hrs and has a trading volume of 1.144 Billion USD.
We can see a decrease of 13.79% in the trading volumes of Ripple as compared to yesterday, which appears to be normal.
This Week Ahead
Ripple has entered a consolidation zone above the 0.3600 handle, and the prices are expected to remain in the range bounded movement this week oscillating between the 0.3800 and 0.3500 levels.
The price of XRPUSD is expected to decline further touching the 0.3300 handle after which a recovery is expected into the markets.
We can see the formation of the adaptive moving average 20 and 50 crossover patterns in the 1-hour time frame, indicating the underlying bearish nature of the markets.
The weekly outlook for Ripple is projected at 0.3800 with a consolidation zone of 0.3600.
Technical Indicators:
The relative strength index (14): at 41 indicating a SELL
The commodity channel index: at -67.55 indicating a SELL
The rate of price change: at -1.70 indicating a SELLThe average directional change(14days): at 14.72 indicating a Neutral
FXOpen offers the world's most popular cryptocurrency CFDs*, including Bitcoin and Ethereum. Floating spreads, 1:2 leverage — at your service (additional fees may apply). Open your trading account now or learn more about crypto CFD trading with FXOpen.
*Important: At FXOpen UK, Cryptocurrency trading via CFDs is only available to our Professional clients. They are not available for trading by Retail clients. To find out more information about how this may affect you, please get in touch with our team.
This article represents the opinion of the Companies operating under the FXOpen brand only. It is not to be construed as an offer, solicitation, or recommendation with respect to products and services provided by the Companies operating under the FXOpen brand, nor is it to be considered financial advice.
Stay ahead of the market!
Subscribe now to our mailing list and receive the latest market news and insights delivered directly to your inbox.


Latest articles

Bank of America: Strong Earnings Reignite Buying Interest
On 15 April 2026, Bank of America reported its Q1 2026 financial results, exceeding analysts’ consensus estimates for both profit and revenue. Net income came in at $8.6 billion (+17% year-on-year), while revenue reached $30.3 billion (+7% YoY)

EUR/USD and GBP/USD Continue to Strengthen Ahead of Data Releases
European currencies are maintaining an upward trajectory, having reached previously outlined levels amid sustained demand for the euro and the pound. The current advance is developing against a backdrop of gradually shifting market expectations and ongoing pressure on the US

Market Analysis: EUR/USD Breakout Builds, USD/CHF Slides Lower Again
EUR/USD started a fresh surge above 1.1740 and 1.1780. USD/CHF declined further and is now struggling below 0.7850.
Important Takeaways for EUR/USD and USD/CHF Analysis Today
· The Euro started a major increase from