


BTCUSD and XRPUSD Technical Analysis – 06th DEC 2022
FXOpen

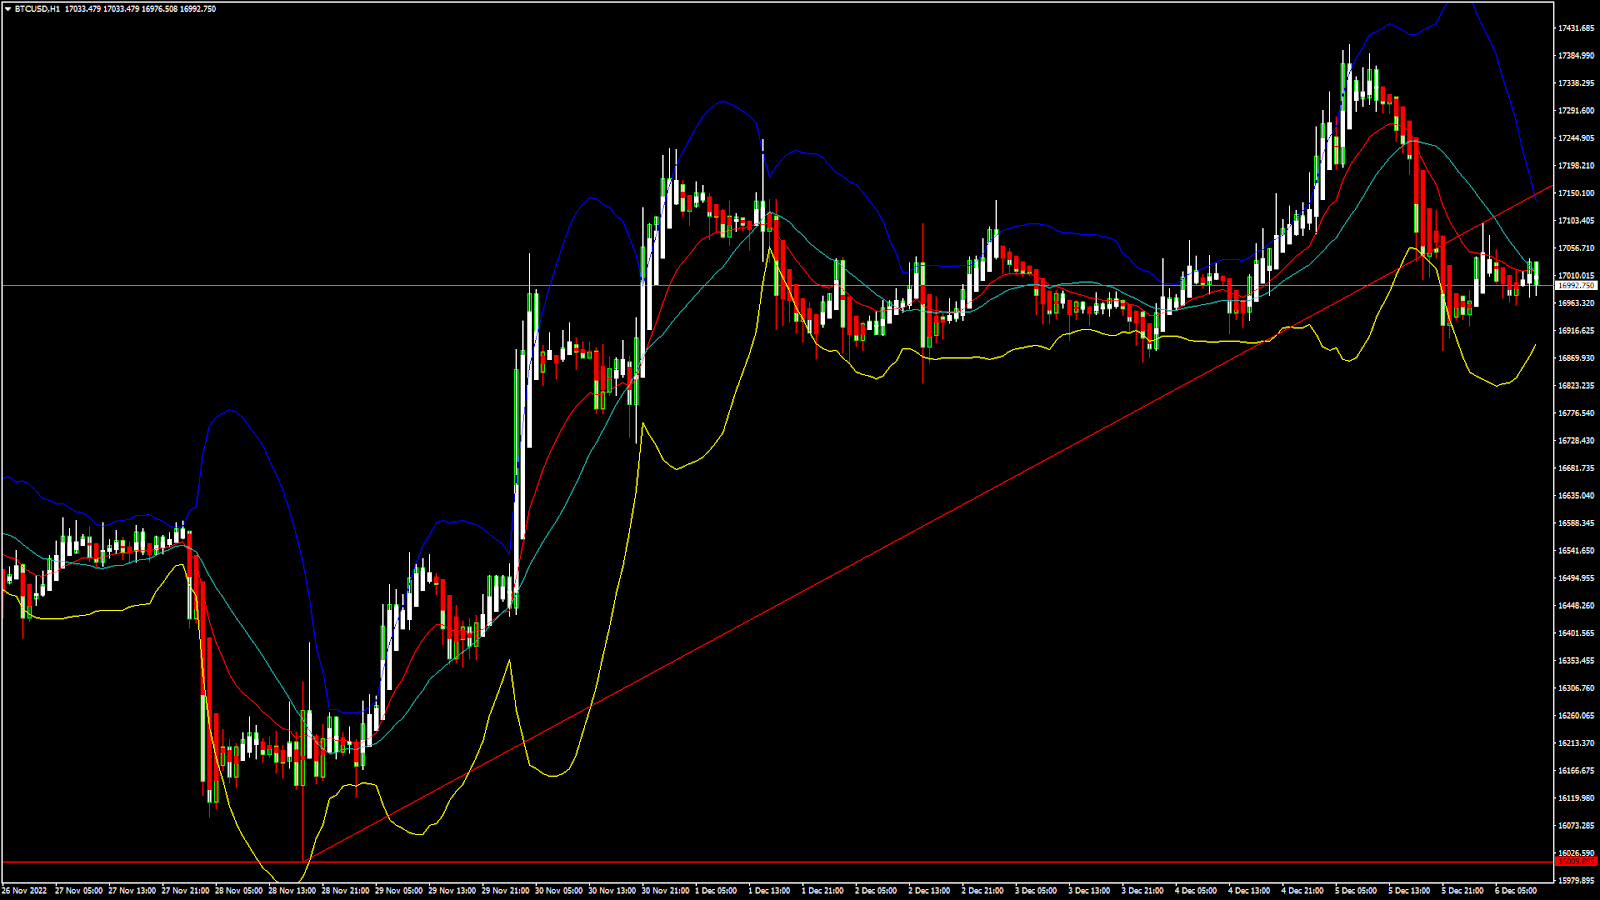
BTCUSD: Inverted Hammer Pattern Above $16009
Bitcoin was unable to sustain its bearish momentum and after touching a low of 16009 on 28th Nov, the prices started to correct upwards against the US dollar crossing the $17000 handle on 06th Dec.
We have seen a continued escalation in the prices of bitcoin due to the increasing global demands and buying at lower levels.
The resistance of the channel is broken in the 15-minute time frame indicating bullish trends.
We can see a bullish trend reversal pattern with the adaptive moving averages, AMA5, in the 15-minute time frame, and AMA20 in the 30-minute time frame.
We can clearly see an inverted hammer pattern above the $16009 handle which is a bullish reversal pattern because it signifies the end of a downtrend and a shift towards an uptrend.
Bitcoin touched an Intraday low of 16924 and an intraday high of 17098 in the Asian trading session today.
Both the STOCH and STOCHRSI are indicating overbought levels which means that in the immediate short term, a decline in the prices is expected.
The relative strength index is at 50 indicating a NEUTRAL demand for bitcoin, and the shift towards the consolidation channel in the markets.
Bitcoin is now moving below its 100 hourly simple moving average and its 200 hourly exponential moving averages.
Most of the major technical indicators are giving a STRONG BUY signal, which means that in the immediate short term, we are expecting targets of 18000 and 18500.
The average true range is indicating LESS market volatility with a mildly bullish momentum.
- Bitcoin: bullish reversal seen above $16009
- The Williams percent range is indicating an overbought level
- The price is now trading just below its pivot level of $17093
- Some of the moving averages are giving a BUY market signal
Bitcoin: Bullish Reversal Seen Above $16009
We can now see that the price of bitcoin is moving in a mildly bullish momentum and we are expecting moves towards the consolidation phase before any upwards rebound this week.
The RSI indicator is back over 50 indicating a bullish scenario in the daily time frame.
The ichimoku – bullish crossover: tenkan & kijun pattern is seen in the daily time frame indicating bullish trends.
We can see the formation of an inverted hammer / white gravestone pattern in the weekly time frame.
The price of bitcoin has crossed the $17000 handle today ranging near to a three-week High.
The immediate short-term outlook for bitcoin is mildly bullish, the medium-term outlook has turned bullish, and the long-term outlook remains neutral under present market conditions.
Bitcoin’s support zone is located at $16716 at which the price crosses the 9-day moving average.
The price of BTCUSD is now facing its classic resistance level of 17300 and Fibonacci resistance level of 17627 after which the path towards 18000 will get cleared.
In the last 24hrs BTCUSD has decreased by 1.85% by 320$ and has a 24hr trading volume of USD 18.733 billion. We can see a decrease of 12.48% in the trading volume compared to yesterday, which appears to be normal.
The Week Ahead
The price of Bitcoin is expected to enter the super bullish zone above the $17000 handle. There is an ascending channel forming with current support at $16395 on the hourly chart of BTCUSD.
We are now preparing to enter the super bullish zone in bitcoin and the prices are expected to gain 100% from the current market levels of $17000 towards $34000 in the starting of next year.
We can see a continuous progression of a bullish trend line formation from $16009 towards the $17169 levels.
The daily RSI is printing at 47 which indicates a NEUTRAL demand for bitcoin and the possibility of a shift towards the consolidation/correction phase for a short term in the markets.
The price of BTCUSD is now facing its resistance zone at $17810 at which the price crosses 18-day moving average stalls.
The weekly outlook is projected at $18500 with a consolidation zone of $18000.
Technical Indicators:
The average directional index, ADX (14): is at 27.55 indicating a BUY
The commodity channel index, CCI (14): is at 84.15 indicating a BUY
The rate of price change, ROC: is at 4.84 indicating a BUY
Bull/bear power (13): is at 410.57 indicating a BUY
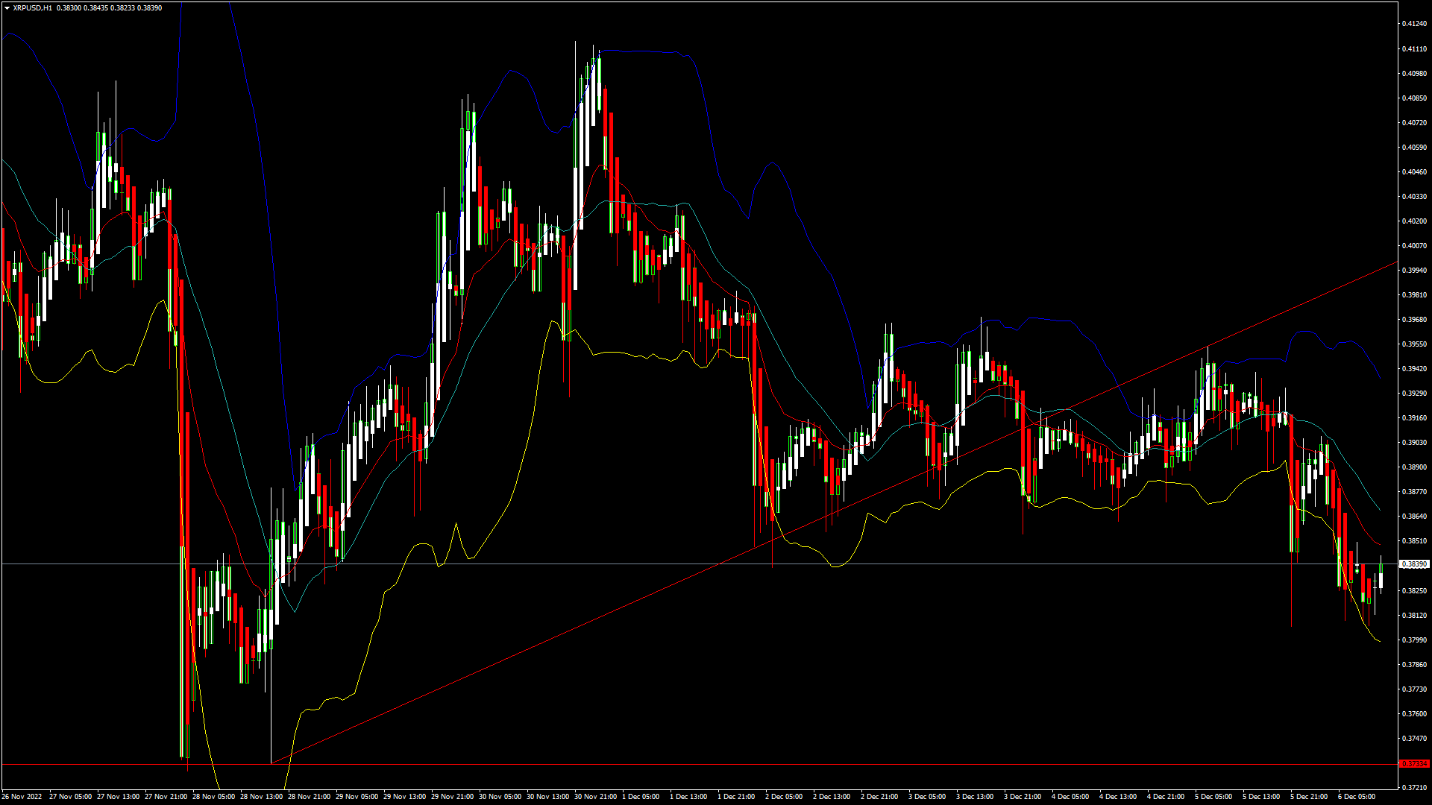
XRPUSD: Three White Soldiers Pattern Above 0.3733
Ripple was unable to sustain its bearish momentum and after touching a low of 0.3733 on 28th Nov, the prices started to correct upwards against the US dollar crossing the $0.4000 handle on 01st Dec.
The price of Ripple is moving in a mildly bullish zone, and we are now heading towards the $0.4200 to $0.4500 range.
The price of Ripple is ranging near the support of the triangle in the 1-hour time frame indicating a bullish scenario.
We can clearly see a three white soldiers pattern above the 0.3733 handle which is a bullish reversal pattern because it signifies the end of a downtrend and a shift towards an uptrend.
Ripple touched an intraday high of 0.3906 in the Asian trading session and an intraday low of 0.3806 in the European trading session today.
The relative strength index is at 54.84 which signifies a NEUTRAL demand for Ripple at the current market prices and a shift towards the consolidation channel in the markets.
Most of the moving averages are giving a BUY signal at the current market levels of 0.3839.
Ripple is now trading above its pivot level of 0.3831 and is now facing its classic resistance level of 0.3834 and Fibonacci resistance level of 0.3836 after which the path towards 0.4200 will get cleared.
Most of the major technical indicators are giving a BUY signal.
- Ripple: bullish reversal seen above the 0.3733 levels
- The ultimate oscillator is indicating an OVERBOUGHT level
- The average true range indicates LESS volatility
- Ripple gains bullish bias against the US dollar
Ripple: Bullish Reversal Seen Above 0.3733
We can see that the price of Ripple continues to remain in a consolidation zone formation above the $0.3700 handle and fresh upsides are projected at $0.4000 and $0.4200
The RSI Indicator is giving a bullish divergence signal in the 2-hour time frame.
We can see the formation of a bullish harami cross pattern in the 15-minute time frame.
Some of the indicators are giving a NEUTRAL stance in the markets and the prices are expected to remain in a narrow range before any fresh upside waves.
Both the STOCHRSI and Williams percent range are indicating overbought levels, which means that prices are expected to decline in the short term.
The short-term outlook for Ripple has turned mildly bullish, the medium-term outlook is bullish, and the long-term outlook is neutral under present market conditions.
The price of XRPUSD has decreased by 2.16% with a price change of $0.008497 in the past 24hrs and has a trading volume of 0.836 billion USD.
We can see an increase of 15.51% in the trading volumes of Ripple compared to yesterday, which appears to be normal.
This Week Ahead
The price of Ripple is moving in a mildly bullish momentum against the US dollar and bitcoin. There is a major bullish trendline formation with a support located at $0.3605 which is a 14-3 day raw stochastic at 20%
The price of Ripple has made a failed attempt to cross the $0.4200 handle and now remains below the $0.4000 level.
We can see a continuous progression of a bullish trend line formation from $0.3733 towards the $0.4000 level.
The resistance zone is located at $0.4249 at which the price crosses the 40-day moving average.
The weekly outlook for Ripple is projected at $0.4400 with a consolidation zone of $0.4200.
Technical Indicators:
The STOCH (9,6): is at 74.04 indicating a BUY
The commodity channel index, CCI (14): is at 81.55 indicating a BUY
The rate of price change: is at 0.123 indicating a BUY
Bull/bear power (13): is at 0.0001 indicating a BUY
FXOpen offers the world's most popular cryptocurrency CFDs*, including Bitcoin and Ethereum. Floating spreads, 1:2 leverage — at your service (additional fees may apply). Open your trading account now or learn more about crypto CFD trading with FXOpen.
*Important: At FXOpen UK, Cryptocurrency trading via CFDs is only available to our Professional clients. They are not available for trading by Retail clients. To find out more information about how this may affect you, please get in touch with our team.
This article represents the opinion of the Companies operating under the FXOpen brand only. It is not to be construed as an offer, solicitation, or recommendation with respect to products and services provided by the Companies operating under the FXOpen brand, nor is it to be considered financial advice.
Stay ahead of the market!
Subscribe now to our mailing list and receive the latest market news and insights delivered directly to your inbox.


Latest articles

AI Valuations Are Back in the Spotlight
Artificial intelligence remains the dominant investment theme of 2026, but investors are increasingly questioning whether AI stock valuations are keeping pace with reality.
💰 Big Tech continues to invest at an unprecedented scale, with hyperscaler AI spending projected to exceed $800

AUD/CAD: Months of Indecision — Is a Breakout Finally Coming?
The Australian dollar has clawed back most of its end-of-June losses, when it touched three-month lows against the greenback amid escalating Middle East tensions. Since then, sentiment has improved: the RBA's Assistant Governor Sarah Hunter signalled the board stands ready

USD/JPY: Battling at the Top of the Triangle
On 3 July, Japan's Finance Minister, Satsuki Katayama, stated that the Ministry of Finance remains in close contact with US authorities regarding developments in USD/JPY as the yen traded near its weakest level in almost 40 years. Similar verbal